Introduction
Since the Progressive Era in the United States early in the 20th Century, the prevailing wisdom has instructed Americans that progressive taxation of wealth is a necessary condition of social equity. In practice this requires that the wealthy be taxed at steeply increasing rates for increasing levels of income and assets. Over the course of the 20th Century, the highest the nominal rates of federal income taxes rose from modest levels commencing with the personal income tax in 1913 to rates bordering upon total confiscation at mid century. [See Table 1]
Table 1
Selected Maximum Nominal Federal Tax Rates, 1913–2001
| Tax Rate |
Inception
|
Highest
|
Current
|
| Personal Income |
7%
|
94%
|
39.60%
|
| Corporate Income |
1%
|
82%
|
35%
|
| Inheritance |
10%
|
77%
|
55%
|
| Source: Moody, Scott (Editor), Facts & Figures On Government Finance, 34th Edition, Tax Foundation, Washington D.C., 2000: Tables C31, C34 & C39. | |||
The maximum nominal federal income tax rates only show a portion of the marginal rates in composite. A dollar of wage or salary income expended on consumption has a marginal rate equal to nominal. But a dollar saved and invested in a corporation must pay personal tax in order to be invested; corporate income tax before a dividend can be paid; and personal income on the dividend–a composite maximum marginal tax burden at 74.3 percent of the original income invested. Inheritance tax on top of that would leave only 11.6 cents of the original dollar earned, as shown in Table 2.
Table 2
Selected Composite Maximum Marginal Rates, Federal Income Tax, 2001
| Tax |
Personal Consumption
|
Corporate Investment
|
Inheritance of a
Dividend |
| Personal (Wage) |
39.60%
|
39.60%
|
39.60%
|
| Corporate |
--
|
35%
|
35%
|
| Personal (Dividend) |
--
|
39.60%
|
39.60%
|
| Inheritance |
--
|
--
|
55%
|
| Total Tax |
39.60%
|
74.30%
|
88.40%
|
| Source: Ibid., 2). | |||
As the post-World War II boom subsided, it became apparent that high marginal rates were resulting in economic stagnation. Reduced saving and investment had caused declining growth in jobs and incomes by 1960. The Kennedy tax cuts resulted in resumption of economic growth. Similarly, the inflation of the Seventies pushed incomes into higher brackets, slowing investment and economic growth. It took the Reagan tax cuts to enable resumption of a growing economy. However, at present, nominal rates increased by Clinton in 1993 still far exceed average rates on federal income taxes.
Over the course of the 20th Century the soaring revenues of the federal government enabled first relief, next growth of welfare entitlements, then income redistribution. The Depression enabled the federal government to embark upon broad welfare schemes. The highly progressive tax rates adopted during the Depression to pay for welfarism and two world wars, coupled with inflation thereafter, provided the disproportionate escalation of tax revenues. This later enabled the Great Society’s income redistribution schemes without recourse to the voters for the necessary financing. Whereas welfare expenditures appear to have been sought by a plurality of Americans to the extent of social insurance against disability or loss of livelihood, it is doubtful that a majority ever embraced income redistribution by the federal government.
The Objectives of Progressive Taxation
Progressive taxation is purported to serve three primary social objectives. The first and most commonly agreed objective is to redistribute the burden of government taxation from those of lesser means to those more affluent. The second and least publicly acknowledged objective is to provide government with the power to redistribute income from the “wealthy” to the “ poor.” The third objective, which also played an important role in the original public support for progressive taxation was the contention of intellectuals that the economic and political power of wealth required curtailment.
Whether or not progressive taxation has succeeded in increasing the real incomes of those of lesser means from disproportionately taxing those of greater means is the purpose of this study.
Theoretically, increasing the tax share paid by the wealthy, all other influences held constant, should increase the income share after taxes of the remaining taxpayers. The relationship should be linear, with a rising slope as shown in Figure 1. To whatever extent the increase was redistributed income, an additional proportionate increase should occur. Over the four decades covering 1957 through 1997, the mean tax rate on all AGI averaged 13.16 percent; the predicted relationship is a 0.15 percent increase in lower income share after tax for every 1 percent increase in upper income tax share, without considering redistribution.
Figure 1
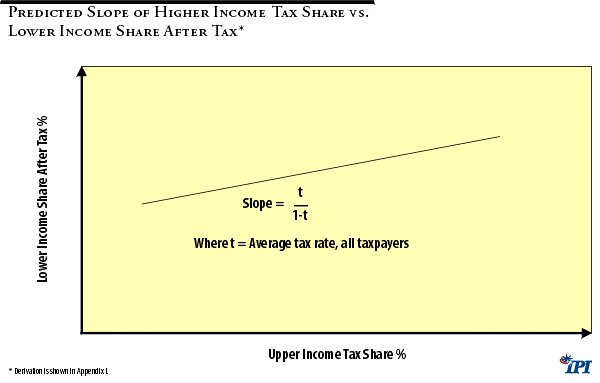
It will be seen in the following that this seemingly obvious cause and effect does not occur, but instead the exact opposite has been observed over the past four decades.
Four Decades of Progressive Taxation, 1957–1997
To compare the effect of tax share versus income share over the four decades 1957–1997, two data sets were required, since a consistent series over this period is not available.1
The group considered most representative of progressive taxation and therefore chosen for analysis purposes was the top 10 percent of incomes as reported on IRS returns. Ever since World War II progressive taxation has reached much farther down the income distribution than just to the so-called “ super-rich” which were the intended targets for confiscatory taxation in the early days of income taxation. With a bottom income cutoff of $79,639 in 1997, the top 10 percent were all subjected to average and marginal tax rates well above those of the average taxpayer, the effective definition of progressive taxation. Top 10 percent of incomes includes a better proportion of returns to “intellectual capital” rather than primarily returns to financial capital, compared to the much discussed “top 1 percent” of income tax returns, which was the recent focus of Joel Slemrod, et. al.2
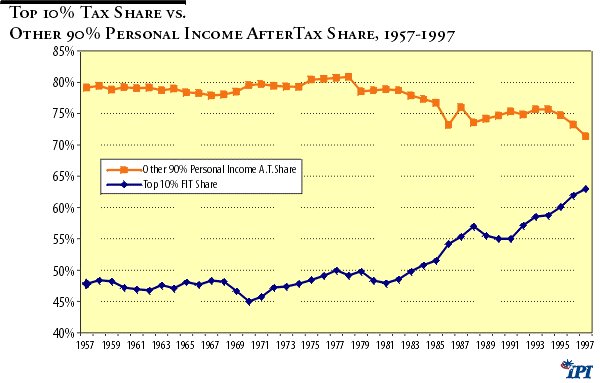
Income shares before and after personal income tax were relatively constant from 1957 through 1971 for both the top 10 percent of taxpayers and the other 90 percent. (See Figure 3) However, since then there has been a steady increase in before and after tax income share of the top 10 percent, necessarily matched by declining income share before and after tax of the remaining 90 percent. Income share before tax of the top 10 percent start to rise perceptibly as early as 1971, as did top 10 percent tax share. Much has been said about this increasing “income inequity,” but little of economic coherence has been said of its root causes and remedies.
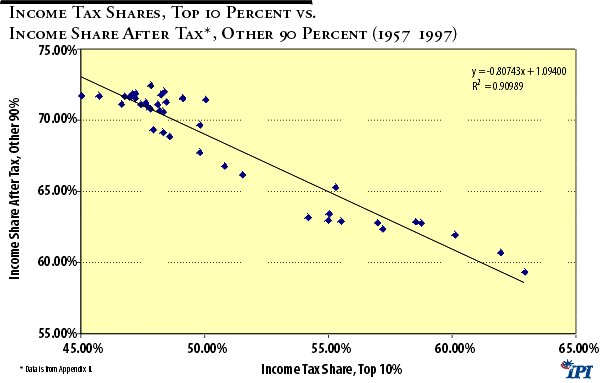
The most revealing relationship shown by this data set resulted from comparing income tax share paid by the top 10 percent of taxpayers to income share after tax of the other 90 percent in Figure 1 over the four decades 1957–1997. As noted above, the primary purpose of progressive taxation is to redistribute income from those of higher incomes to those of lower incomes by disproportionately taxing higher incomes. The higher tax share of those wealthier should thus result in increased income share after tax of the “ less fortunate.”
However, Figure 2 shows exactly the opposite has occurred. Over the four decades 1957 to 1997 there has been a strong negative relationship between tax share paid by the top 10 percent of incomes and the after-tax income share of the other 90 percent.
Figure 2
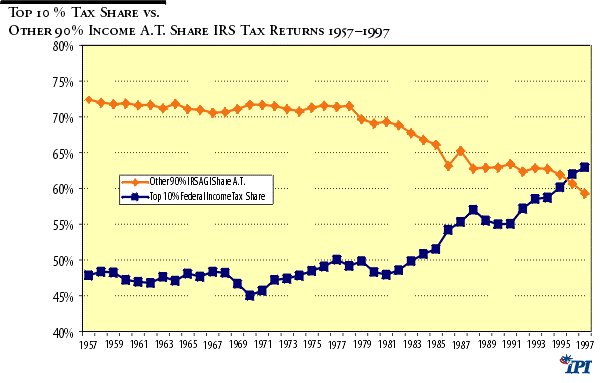
The same data arranged as two time series clearly demonstrates the same relationship. For a period of fifteen years 1957–1973 both top 10% federal income tax share and other 90% after tax income share both stayed relatively constant. In 1971 top 10% FIT share commenced a rise as the Great Society increased income taxation through inflation and “bracket creep,” and redistributed the proceeds. The rise has continued to 1997, the last year for which data is available. After a lag of three years, other 90% after tax income commenced a decline that has likewise continued to present.
Figure 3
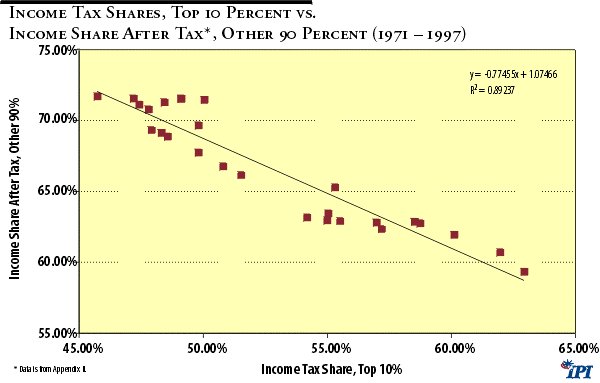
The same comparison for the period 1979–1997 shows not quite so marked a slope from omitting the relatively constant tax shares and after-tax income shares of the 1957–1978 period in Figure 4. But the general result is the same: when tax share of the top 10 percent goes up, the after-tax income share of the other 90 percent goes down. Both relationships yield R2 ’s of 0.9, showing strong statistical correlation.
Figure 4
Despite the increased share of the income tax burden shouldered by the top 10% and vast expansion of welfare to redistribute the increased income taxes collected, the after-tax income of the other 90% declined. Both trends have continued to the present.
Interpretation of The Findings
The excellent statistical correlation observed over the past 40 years between the increasing progressivity of federal income taxation, as measured by the top 10 percent income tax share, and the decreasing income share of the other 90 percent of income after income tax, is an evident fact. However, to establish that a cause and effect relationship exists, it is necessary to dispel the possibilities of coincidental effects of alternative causes or, alternatively, a relationship based upon faulty data. Also, so powerful relationship as that observed should have corroborating evidence from other sources if real causality is to be believed. The following questions seek such confirmations:
1. Is the result observed only a consequence of increasing inequality of income distribution resulting from disproportionate growth of the incomes of the wealthy?
In order to answer this question, the growth of before-tax mean income reported for the top 10 percent of IRS returns is compared to the growth of three other measures of before-tax income for selected periods during the four decades 1957 through 1997. The other measures of income before FIT are: mean income of the other 90 percent of IRS returns; median married couple total compensation; and mean income of the other 90 percent of personal income from Appendix II.³ The basis of comparison is percent growth per year for the period of 1957–1971 versus the period 197–1997, as shown in Table 3.
Table 3
Growth of Top 10% Income before Federal Income Tax Compared to Other Measures of Income
|
Year/ Period
|
Top 10 %
Mean AGI |
Other 90 %
Mean AGI |
Median Married
Total Compensation |
Other 90 %
Mean Personal Income* |
|
(Constant 1997$)
|
||||
|
1957
|
$80,876
|
$22,232
|
$30,943
|
$28,615
|
|
1971
|
$108,592
|
$31,024
|
$48,083
|
$41,315
|
|
Growth
|
34.30%
|
39.50%
|
55.40%
|
44.40%
|
|
Growth Per Year
|
2.10%
|
2.40%
|
3.20%
|
2.65%
|
|
1971
|
$108,592
|
$31,028
|
$48,083
|
$41,315
|
|
1997
|
$180,338
|
$30,878
|
$60,713
|
$48,524
|
|
Growth
|
66.30%
|
-0.50%
|
26.30%
|
17.50%
|
|
Growth Per Year
|
2.15%
|
0%
|
0.90%
|
0.65%
|
| Source: Data is from Appendix II.
* For adults paired the same as top 10 percent incomes. |
||||
What Table 3 shows is that the average growth of top 10 percent mean income before FIT was virtually the same at 2.15 percent per year from 1971 through 1997 compared to 2.10 percent per year for the period of 1957–1971. The growth was sharply reduced for all three measures of income other than the top 10 percent for the period of 1971–1997 compared to 1957–1971. Whereas all three of the later income measures significantly exceeded the growth of top 10 percent income during the 1957–1973 period during which the tax share of the top 10 percent was relatively constant, income growth was sharply reduced or nil for measures of other income from 1971–1997, the period of continuous rise of the top 10 percent tax share.
The decline of the other 90 percent income share clearly was not due to a disproportionate increase in the growth rate of the top 10 percent income. It was due to historically subnormal growth of the other 90 percent of incomes.
2. Did incomplete and/or misleading measure of lower incomes reported as AGI on IRS tax returns result in the observed relationship to the top 10 percent tax share versus the other 90 percent income share after tax?
There has been a declining trend of married couple families as a proportion of all families, particularly among lower-income families. However, marriage remains the typical status of the top 10 percent of IRS returns, 88 percent of which were marital returns in 1995. Also, AGI does not include certain government transfer payments. Rector and Hederman of the Heritage Foundation 3 found such factors cause AGI to significantly overstate income inequality. Do such deficiencies in the data account for the “income phenomena” observed?
This possibility was investigated by examining the top 10 percent tax share versus other 90 percent income share after tax relationship using income share after tax of the other 90 percent constructed on the basis of Total Personal Income from the NIPA accounts. The top 10 percent tax share basis stayed the same, but the other 90 percent income after FIT was constructed as Total Personal Income less the top 10 percent AGI. Figure 5 shows that this reduced, but did not alter the negative relationship found in Exhibit I between the top 10 percent tax share and the after-tax income share of the other 90 percent of incomes.
Figure 5
The correction of differences in family groupings and the inclusion of transfer payments and fringe benefits resulting from using NIPA personal income as the basis for other 90 percent income does not alter the findings shown earlier based solely upon AGI.
3. Is there corroborating evidence that increasing the progressivity of upper income taxation has perverse effects upon all incomes?
During the same period 1957–1997, there were four periods where tax policy had directly observable changes in the average FIT rate on upper incomes, 4 with consequent changes in incomes. These were identifiable as:
• The “Kennedy tax cuts” of 1963
• The hyperinflation of 1972–1981
• The “Reagan tax cuts” of 1981
• The “Clinton tax increases” of 1993
The effects of changes in progressivity are examined in Table 4 comparing the significant changes in the average FIT rate on the top 10 percent of incomes to the resultant changes in top 10 percent income and three measures of other income growth before and after the changes in tax rate.
Table 4
Change in Average Top Percent FIT Rate vs. Various Measures of Income Growth
|
Period
|
Top 10% Chg. Avg. Tax Rate |
Top 10% Mean AGI Income BT |
Other 90% Mean AGI Income BT |
Median Married Compensation BT |
Other 90% Personal Income BT |
|
| (Constant 1996$) | ||||||
| 1963-1967 (Kennedy Cuts) |
4 Yr % Change | -4.76% | +3.26%/Yr | +2.88%/Yr | +4.33%/Yr | +3.59%/Yr |
| Prior 4 Yr % Chg | 0.50% | +2.44%/Yr | +2.24%/Yr | +2.94%/Yr | +2.44%/Yr | |
| 1972-1981 (Stagflation) |
9 Yr % Change | 13.26% | +0.09%/Yr | -1.24%/Yr | +0.27%/Yr | -0.171%/Yr |
| Prior 9 Yr % Chg | -3.56% | +2.07%/Yr | +2.71%/Yr | +3.56%/Yr | +3.15%/Yr | |
| 1981-1985 (Reagan Cuts) |
4 Yr % Change | -15.43% | +3.92%/Yr | +0.76%/Yr | +1.42%/Yr | +1.62%/Yr |
| Prior 4 Yr % Chg | -0.55% | +0.67%/Yr | -0.85%/Yr | -1.01%/Yr | -1.28%/Yr | |
| 1992-1996 (Clinton Increases Progressivety) |
4 Yr % Change | 13.85% | +2.61%/Yr | -0.20%/Yr | +1.16%/Yr | +0.41%/Yr |
| Prior 4 Yr % Chg | -3.68% | -0.50%/Yr | -0.53%/Yr | -0.43%/Yr | +1.18%/Yr | |
| NOTE: Total Personal Income (NIPA) less Top 10% AGI per household with same number adults per household as Top 10%. | ||||||
The reduction of the top 10 percent average FIT rates in 1963 and 1981 had the effect of promoting significantly higher income growth in the ensuing periods than observed prior to the tax cuts. The “bracket creep” during the hyperinflation of 1971 to 1981 severely reduced growth of incomes. Whereas the Clinton tax increases on the top 10 percent incomes appear to refute the 1971–1981 experience, the singular boom of the information sector may only be hiding the perverse income effects. The laggard “old economy,” the ballooning trade deficit and the onset of recession confirm grounds for concern.
Overall, the experience of the past 40 years shows reducing marginal rates on financial and intellectual capital promotes income growth, whereas increased marginal rates reduce income growth.
4. Is progressive taxation based upon misconceptions as to the reality of the incidence of the tax burden?
Whatever the political intent, constructive or punitive, it would appear that the effective incidence of high marginal progressive rates of taxation on both physical and intellectual capital is not as intended. Relatively unabated rate of growth of mean income after tax of the top 10 percent of incomes from 1957 to 1971 compared to growth from 1971 to 1997, 2.1 percent per year verses 2.15 percent per year despite increased tax share, suggests that the preponderance of the tax incidence lies elsewhere. So does the relatively constant real after-tax return to capital that Gary and Aldona Robbins5 found during the same period for all U.S. capital.
In a 1994 monograph for the American council for capital formation, Arnold Harberger6 observed that for a corporate income tax in an open world economy such as has evolved, that:
The key point is that in the overall tax incidence there can be important effects on consumers of the output of different sectors, and extremely important effects on the wages of labor.
The effects of levying or increasing a corporate income tax predicted by Harberger in an open economy in all sectors is to cause lowered labor wages, but not lower returns to capital in all sectors.
The findings presented here suggest that progressive taxation on intellectual capital has similar effective incidence on the real wages of labor.
The evidence strongly suggests that the real income effects of high marginal taxation of physical and intellectual capital is lowered real income after tax for all Americans, and that more proportionate taxation should be adopted to promote economic efficiency—with equity of income distribution left to the impartial judgment of the markets.
Conclusions for Public Policy
Given that increasing the share of taxes paid by the wealthy does not increase the after-tax income of the remainder of incomes, then serious re-examination of public policy is necessary. We are paying a high price for high marginal tax rates that limit domestic capital formation and income growth, but where are the offsetting benefits? What are the real costs incurred by punishing the productive and subsidizing the unproductive? What unwholesome behavioral and demographic trends are being promoted? Is the most perverse consequence an increased tax wedge on physical and intellectual capital whose cost is primarily borne by workers and consumers through lost jobs, lower incomes and higher prices?
The fact that the hallowed institution of progressive taxation has evidently failed to redistributed income cannot be ignored. The federal collection of progressive income taxes has corrupted definitions of the law and equity and few will question that to a greater or lesser degree it is economically inefficient. It would seem that if it worsens rather than decreases disparity of income distribution, then only one realistic conclusion could follow: progressive taxation for income redistribution has achieved the opposite of its objectives of helping persons of lesser means.
As for the third objective of progressive taxation, limiting the power of the wealthy, consider the power of the federal government today and recall what the excessive power of the state led to in Russia and Germany. Would not return of some of this power from the state to individuals better limit concentration of power and better secure our freedoms?
Progressive taxation is a demonstrated failure that demands remedy by fundamental tax reform. That tax reform should be rooted in an amendment to the Constitution of the United States as follows:
No tax shall have more than one rate which shall be equally applicable to all taxpayers, and any deduction exemption, or credit against a tax shall be equally beneficial to all taxpayers.
The result would be a return to the long-standing principles of civilized taxation adopted at the founding of the Republic: equality before the law in taxation through the principle of proportionality. Generous family credits for the taxes on basic necessities could prevent regressive hardship on those of lesser means.
Americans would find once again that poverty is best dispelled by growth-oriented public policies promoting a growing economic tide that raises all boats, not the unproductive misallocations of government largesse from confiscation of the efforts of our most productive citizens and productive capital.
The Clinton tax hike of 1993, which increased progressivity of income tax, rates raised marginal rates and the tax wedge American goods and services must suffer in increasingly competitive world markets. The New Economy information market boom has masked the growing competitive disadvantage of the United States in the far larger Old Economy markets, as witnessed by the balance of trade hemorrhage.
As the loss of jobs and income has testified now that the New Economy capital investment boom has subsided, the case for fundamental tax reform has been clearly evident for decades.
Endnotes
1. A recent paper by Petska, Strudler and Petska provided the necessary data to construct the desired tables for the period 1979–1997, based upon the “1979 income concept” they adopted for consistency. Earlier data extending from 1957–1978 was constructed by interpolation from tables presented in the “Individual Income Tax Shares 1951–1986 published by the IRS.” Mean income and average tax rate data for the top 10 percent of returns interpolated from this series, combined with historical SOI datafor total returns plus total AGI and income tax allowed construction of the additional “top 10 percent” and “other 90 percent” data for 1957–1978.
2. Slemrod, Joel B. (Editor), Does Atlas Shrug?, Russell Sage Foundation, Harvard University Press, Cambridge, MA, 2000.
3. Rector , Robert and Hederman, Rea, “Income Inequality: How Census Data Misrepresent Income Distribution,” CDA-9907, The Heritage Foundation, Washington D.C., September 29, 1999.
4. See Ibid. 2.), Table C31, for changes in IRS policy.
5. Robbins, Gary & Aldona, “Capital Taxes and Growth,” National Center for Policy Analysis Report No. 169, Dallas, TX, January 1992, Table 1, p. 7.
6. Harberger, Arnold C., “The ABC’s of Corporate Tax Incidence,” Monograph presented in Tax Policy and Economic Growth, American Council for Capital Formation, Washington D.C., 1994.
Appendix I
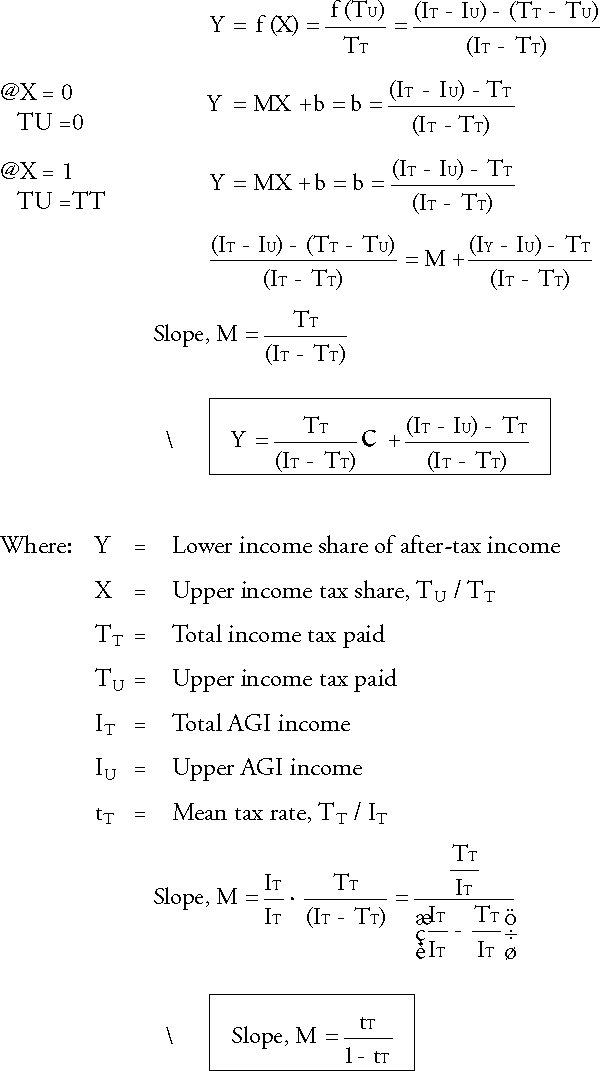
Derivation Of Slope of Relationship:
Lower Income Share after Income Tax Versus Upper Income Tax Share
Appendix II
FIT and AGI Shares, 1957 - 1997: Top 10% vs. Other 90% IRS Returns, 1996$
| Year |
TOP 10%
|
OTHER 90%
|
||||||||||
|
BT MEAN INC 96$
|
AT MEAN INC 96$
|
INC SHR B.T.
|
INC SHR A.T.
|
AVG INC FIT RATE
|
INC TAX SHARE
|
BT MEAN INC 96$
|
AT MEAN INC 96$
|
INC SHR
B.T. |
INC SHR
A.T. |
AVG INC
FIT RATE |
INC
TAX SHARE |
|
| 1957 |
$80,876
|
$65,048
|
30.06%
|
27.57%
|
19.57%
|
47.84%
|
$20,688
|
$18,794
|
69.94%
|
72.43%
|
9.15%
|
52.16%
|
| 1958 |
$80,109
|
$64,608
|
30.49%
|
28.00%
|
19.35%
|
48.37%
|
$20,295
|
$18,456
|
69.51%
|
72.00%
|
9.06%
|
51.63%
|
| 1959 |
$85,384
|
$68,444
|
30.77%
|
28.24%
|
19.84%
|
48.24%
|
$21,346
|
$19,327
|
69.23%
|
71.78%
|
9.46%
|
51.76%
|
| 1960 |
$85,054
|
$68,562
|
30.50%
|
28.10%
|
19.39%
|
47.23%
|
$21,536
|
$19,489
|
69.50%
|
71.90%
|
9.51%
|
52.77%
|
| 1961 |
$88,036
|
$70,834
|
30.75%
|
28.37%
|
19.54%
|
46.96%
|
$22,033
|
$19,868
|
69.25%
|
71.63%
|
9.83%
|
53.04%
|
| 1962 |
$90,252
|
$72,553
|
30.71%
|
28.33%
|
19.61%
|
46.77%
|
$22,628
|
$20,390
|
69.29%
|
71.67%
|
9.89%
|
53.23%
|
| 1963 |
$94,013
|
$75,267
|
31.23%
|
28.76%
|
19.94%
|
47.64%
|
$23,001
|
$20,712
|
68.77%
|
71.24%
|
9.95%
|
52.36%
|
| 1964 |
$97,949
|
$79,897
|
30.41%
|
28.15%
|
18.43%
|
47.10%
|
$24,910
|
$22,657
|
69.59%
|
71.85%
|
9.04%
|
52.90%
|
| 1965 |
$100,091
|
$82,205
|
31.11%
|
28.89%
|
17.87%
|
48.11%
|
$24,622
|
$22,479
|
68.89%
|
71.11%
|
8.70%
|
51.89%
|
| 1966 |
$102,673
|
$83,905
|
31.23%
|
28.99%
|
18.28%
|
47.68%
|
$25,119
|
$22,831
|
68.77%
|
71.01%
|
9.11%
|
52.32%
|
| 1967 |
$106,877
|
$86,581
|
31.77%
|
29.41%
|
18.99%
|
48.34%
|
$25,505
|
$23,095
|
68.23%
|
70.59%
|
9.45%
|
51.66%
|
| 1968 |
$110,196
|
$87,198
|
31.94%
|
29.33%
|
20.87%
|
48.19%
|
$26,089
|
$23,342
|
68.06%
|
70.67%
|
10.53%
|
51.81%
|
| 1969 |
$108,835
|
$85,653
|
31.43%
|
28.88%
|
21.30%
|
46.66%
|
$26,378
|
$23,434
|
68.57%
|
71.12%
|
11.16%
|
53.34%
|
| 1970 |
$106,701
|
$85,777
|
30.51%
|
28.28%
|
19.61%
|
45.04%
|
$27,002
|
$24,166
|
69.49%
|
71.72%
|
10.50%
|
54.96%
|
| 1971 |
$108,592
|
$87,949
|
30.52%
|
28.31%
|
19.01%
|
45.75%
|
$27,471
|
$24,752
|
69.48%
|
71.69%
|
9.90%
|
54.25%
|
| 1972 |
$113,058
|
$91,317
|
30.80%
|
28.45%
|
19.23%
|
47.21%
|
$28,222
|
$25,517
|
69.20%
|
71.55%
|
9.59%
|
52.79%
|
| 1973 |
$115,384
|
$92,550
|
31.32%
|
28.90%
|
19.79%
|
47.43%
|
$28,114
|
$25,301
|
68.68%
|
71.10%
|
10.00%
|
52.57%
|
| 1974 |
$111,720
|
$88,750
|
31.75%
|
29.21%
|
20.56%
|
47.82%
|
$26,688
|
$23,903
|
68.25%
|
70.79%
|
10.44%
|
52.18%
|
| 1975 |
$107,062
|
$85,286
|
31.30%
|
28.71%
|
20.34%
|
48.46%
|
$26,110
|
$23,537
|
68.70%
|
71.29%
|
9.86%
|
51.54%
|
| 1976 |
$108,976
|
$85,906
|
31.22%
|
28.44%
|
21.17%
|
49.12%
|
$26,670
|
$24,015
|
68.78%
|
71.56%
|
9.95%
|
50.88%
|
| 1977 |
$110,187
|
$86,056
|
31.53%
|
28.56%
|
21.90%
|
50.06%
|
$26,590
|
$23,915
|
68.47%
|
71.44%
|
10.06%
|
49.94%
|
| 1978 |
$111,748
|
$86,538
|
31.48%
|
28.49%
|
22.56%
|
49.14%
|
$27,030
|
$24,131
|
68.52%
|
71.51%
|
10.72%
|
50.86%
|
| 1979 |
$119,051
|
$93,994
|
33.06%
|
30.34%
|
21.05%
|
49.84%
|
$26,774
|
$23,972
|
66.94%
|
69.66%
|
10.46%
|
50.16%
|
| 1980 |
$115,275
|
$90,954
|
33.42%
|
30.87%
|
21.10%
|
48.35%
|
$25,529
|
$22,641
|
66.58%
|
69.13%
|
11.31%
|
51.65%
|
| 1981 |
$114,001
|
$89,168
|
33.28%
|
30.67%
|
21.78%
|
47.94%
|
$25,390
|
$22,394
|
66.72%
|
69.33%
|
11.80%
|
52.06%
|
| 1982 |
$114,468
|
$91,285
|
33.59%
|
31.15%
|
20.25%
|
48.57%
|
$25,148
|
$22,420
|
66.41%
|
68.85%
|
10.85%
|
51.43%
|
| 1983 |
$120,530
|
$97,960
|
34.54%
|
32.26%
|
18.73%
|
49.82%
|
$25,370
|
$22,845
|
65.46%
|
67.74%
|
9.95%
|
50.18%
|
| 1984 |
$127,122
|
$103,587
|
35.50%
|
33.23%
|
18.51%
|
50.83%
|
$25,648
|
$23,119
|
64.50%
|
66.77%
|
9.86%
|
49.17%
|
| 1985 |
$132,049
|
$107,731
|
36.12%
|
33.84%
|
18.42%
|
51.52%
|
$25,933
|
$23,392
|
63.88%
|
66.16%
|
9.80%
|
48.48%
|
| 1986 |
$153,946
|
$126,046
|
39.12%
|
36.85%
|
18.12%
|
54.19%
|
$26,636
|
$24,014
|
60.88%
|
63.15%
|
9.84%
|
45.81%
|
| 1987 |
$138,884
|
$112,315
|
37.37%
|
34.71%
|
19.13%
|
55.33%
|
$25,851
|
$23,468
|
62.63%
|
65.29%
|
9.22%
|
44.67%
|
| 1988 |
$152,950
|
$124,291
|
39.80%
|
37.22%
|
18.74%
|
56.99%
|
$25,694
|
$23,292
|
60.20%
|
62.78%
|
9.35%
|
43.01%
|
| 1989 |
$149,713
|
$122,405
|
39.48%
|
37.09%
|
18.24%
|
55.52%
|
$25,503
|
$23,072
|
60.52%
|
62.91%
|
9.53%
|
44.48%
|
| 1990 |
$146,539
|
$120,323
|
39.33%
|
37.03%
|
17.89%
|
55.02%
|
$25,101
|
$22,721
|
60.67%
|
62.97%
|
9.48%
|
44.98%
|
| 1991 |
$140,758
|
$115,785
|
38.89%
|
36.57%
|
17.74%
|
55.04%
|
$24,590
|
$22,323
|
61.11%
|
63.43%
|
9.22%
|
44.96%
|
| 1992 |
$149,811
|
$122,767
|
40.11%
|
37.64%
|
18.05%
|
57.19%
|
$24,847
|
$22,598
|
59.89%
|
62.36%
|
9.05%
|
42.81%
|
| 1993 |
$146,809
|
$118,714
|
39.94%
|
37.14%
|
19.14%
|
58.54%
|
$24,530
|
$22,319
|
60.06%
|
62.86%
|
9.01%
|
41.46%
|
| 1994 |
$148,752
|
$119,852
|
40.09%
|
37.24%
|
19.43%
|
58.76%
|
$24,705
|
$22,451
|
59.91%
|
62.76%
|
9.13%
|
41.24%
|
| 1995 |
$155,605
|
$124,561
|
41.06%
|
38.06%
|
19.95%
|
60.12%
|
$24,808
|
$22,521
|
58.94%
|
61.94%
|
9.22%
|
39.88%
|
| 1996 |
$166,100
|
$131,967
|
42.50%
|
39.30%
|
20.55%
|
61.98%
|
$24,975
|
$22,648
|
57.50%
|
60.70%
|
9.32%
|
38.02%
|
| 1997 |
$180,272
|
$143,267
|
43.86%
|
40.67%
|
20.53%
|
62.96%
|
$25,650
|
$23,230
|
56.14%
|
59.33%
|
9.43%
|
37.04%
|
| MEAN |
$119,425
|
$96,045
|
34.24%
|
31.71%
|
19.62%
|
50.92%
|
$25,140
|
$22,672
|
65.76%
|
68.29%
|
9.80%
|
49.08%
|
| %CHG 57–97 |
122.9%
|
120.2%
|
45.9%
|
47.5%
|
4.9%
|
31.6%
|
24.0%
|
23.6%
|
-19.7%
|
-18.1%
|
3.1%
|
-29.0%
|
| %CHG 57–78 |
38.2%
|
33.0%
|
4.7%
|
3.3%
|
15.3%
|
2.7%
|
30.7%
|
28.4%
|
-2.0%
|
-1.3%
|
17.2%
|
-2.5%
|
| %CHG 79–97 |
51.4%
|
52.4%
|
32.7%
|
34.1%
|
-2.5%
|
26.3%
|
-4.2%
|
-3.1%
|
-16.1%
|
-14.8%
|
-9.8%
|
-26.2%
|
| %CHG 57–71 |
34.3%
|
35.2%
|
1.5%
|
2.7%
|
-2.9%
|
-4.4%
|
32.8%
|
31.7%
|
-0.7%
|
-1.0%
|
8.2%
|
4.0%
|
| %CHG 71–97 |
66.0%
|
62.9%
|
43.7%
|
43.7%
|
8.0%
|
37.6%
|
-6.6%
|
-6.1%
|
-19.2%
|
-17.2%
|
-4.7%
|
-31.7%
|
| %CHG 57–92 |
85.2%
|
88.7%
|
33.4%
|
36.5%
|
-7.8%
|
19.6%
|
20.1%
|
20.2%
|
-14.4%
|
-13.9%
|
-1.1%
|
-17.9%
|
| %CHG 92–97 |
20.3%
|
16.7%
|
9.3%
|
8.1%
|
13.7%
|
10.1%
|
3.2%
|
2.8%
|
-6.3%
|
-4.9%
|
4.2%
|
-13.5%
|
Appendix III
Change in Average Top Percent FIT Rate vs. Various Measures of Income Growth
|
Year/ Period
|
Top 10%
Chg. Avg. Tax Rate |
Top 10%
Mean AGI Income BT |
Other 90%
Mean AGI Income BT |
Median
Married Compensation BT |
Other 90%
Personal Income BT |
|
(Constant 1996$)
|
|||||
|
1959
|
19.84%
|
$85,384
|
$23,104
|
$33,043
|
$29,449
|
|
1963
|
19.94%
|
$94,013
|
$25,244
|
$37,102
|
$32,429
|
|
1967
|
18.99%
|
$106,877
|
$28,276
|
$43,961
|
$37,338
|
|
4 Yr % Change
|
-4.76%
|
+3.26% / Yr
|
+2.88% / Yr
|
+4.33% / Yr
|
+3.59% / Yr
|
|
Prior 4 Yr % Chg
|
0.50%
|
+2.44% / Yr
|
+2.24% / Yr
|
+2.94% / Yr
|
+2.44% / Yr
|
|
1963
|
19.94%
|
$94,013
|
$25,244
|
$37,102
|
$32,429
|
|
1972
|
19.23%
|
$113,058
|
$32,115
|
$50,842
|
$42,876
|
|
1981
|
21.78%
|
$113,962
|
$30,580
|
$52,107
|
$42,208
|
|
9 Yr % Change
|
13.26%
|
+0.09% / Yr
|
-1.24% / Yr
|
+0.27% / Yr
|
-0.171% / Yr
|
|
Prior 9 Yr % Chg
|
-3.56%
|
+2.07% / Yr
|
+2.71% / Yr
|
+3.56% / Yr
|
+3.15% / Yr
|
|
1977
|
21.90%
|
$110,187
|
$31,643
|
$54,277
|
$44,443
|
|
1981
|
21.78%
|
$113,962
|
$30,580
|
$52,107
|
$42,208
|
|
1985
|
18.42%
|
$131,978
|
$31,521
|
$55,120
|
$45,005
|
|
4 Yr % Change
|
-15.43%
|
+3.92% / Yr
|
+0.76% / Yr
|
+1.42% / Yr
|
+1.62% / Yr
|
|
Prior 4 Yr % Chg
|
-0.55%
|
+0.67% / Yr
|
-0.85% / Yr
|
-1.01% / Yr
|
-1.28% / Yr
|
|
1988
|
18.74%
|
$152,892
|
$31,143
|
$58,497
|
$45,809
|
|
1992
|
18.05%
|
$149,865
|
$30,487
|
$57,480
|
$48,015
|
|
1996
|
20.55%
|
$166,121
|
$30,248
|
$60,202
|
$48,805
|
|
4 Yr % Change
|
13.85%
|
+2.61% / Yr
|
-0.20% / Yr
|
+1.16% / Yr
|
+0.41% / Yr
|
|
Prior 4 Yr % Chg
|
-3.68%
|
-0.50% / Yr
|
-0.53% / Yr
|
-0.43% / Yr
|
+1.18% / Yr
|
| NOTE: Total Personal Income (NIPA) less Top 10% AGI per household with same number adults per household as Top 10%. | |||||
Acknowledgment:
Stephen J. Entin of Institute for Research on the Economies of Taxation and Gary Robbins of Fiscal Associates consulted on the statistics and their interpretation for this study.