For over two years, the federal government has been pursuing antitrust action against Microsoft. Much heated debate has surrounded the case, most of it revolving around legal issues. But the broader ramifications for risk assessment, investor confidence and the general economy have been largely ignored.
This issue brief focuses on the macroeconomic costs stemming from the Microsoft case. The next section briefly summarizes what has happened so far. The remaining sections explain why the recent ruling has adversely affected corporate capital and how that effect has spilled over to the rest of the economy.
Current Status
On April 3, 2000, U.S. district court judge Thomas Penfield Jackson ruled that Microsoft had broken federal antitrust law, essentially agreeing with charges brought by the Justice Department. By giving away its Microsoft Internet Explorer web browser as part of its operating system, the world’s largest developer of software had supposedly engaged in predatory pricing practices which, among other things, led to the demise of the company that had dominated the browser market, Netscape.
In early June, Judge Jackson issued his final ruling, which contained proposed remedies. He recommended that Microsoft be split into two companies – one controlling the operating systems and another handling the other applications. The consequences of his ruling, if it ultimately takes effect, are summarized below:
- Microsoft’s operating system company will have to disclose technical program and development information regarding its systems to independent applications developers at the same time as in-house developers.
- The operating systems company will license the browser being offered by Microsoft’s applications company. It cannot incorporate another browser.
- All makers of personal computers will pay the same license fee for Microsoft’s operating systems.
- PC manufacturers will be able to make some changes to the configuration of Windows-based computers, such as disabling Window components.
- Microsoft cannot take any action that could impede the performance of competing products.
Microsoft has appealed the verdict to the U.S. Court of Appeals. Judge Jackson wants his decision to go directly to the Supreme Court. Only time will tell how the appeals process will play out. But the cloud hanging over Microsoft has already done serious damage to the economy. Here is how.
Microsoft Stock Takes a Hit
Anyone owning shares of Microsoft has become all-too-well aware of what happens when the risk associated with an investment suddenly increases. Until this year, Microsoft was one of the best stocks to own, a blue-chip company. The price of shares held since 1991 increased more than twenty times when Microsoft reached its all-time high of almost $120 at the end of last year.1 Investors who bought in 1998 saw their share prices triple.
But since January, Microsoft shares have been in retreat. During the winter months, prices backed off slightly, with shares trading in a range between $90 and $110. But following Judge Jackson's initial verdict, shares of Microsoft plunged the first week of April and reached a 52-week low of $60 by the end of May.2
The value the market places on a stock is its price times the number of shares. With roughly 5.2 million shares outstanding, the market value on Microsoft was about $570 billion at the start of this year. Fallout from news on the decision and proposed remedy, however, helped cut that valuation almost in half by the end of May. With share prices recovering somewhat since then, Microsoft’s market capitalization currently is in the neighborhood of $360 billion. [See Figure 1 for the change in Microsoft market capitalization.]
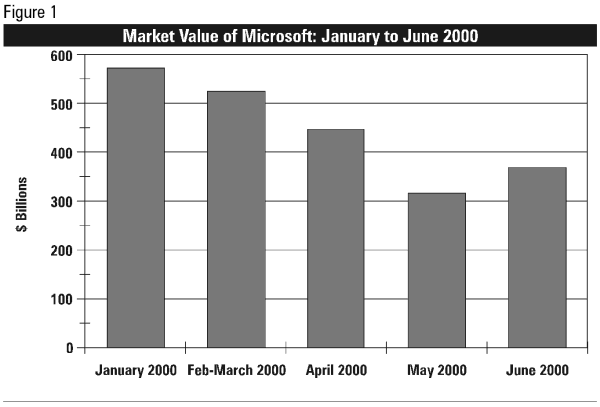
Some of the $210 billion drop in Microsoft’s market value is due to the antitrust decision. The rest could stem from uncertainty surrounding monetary policy and where the economy is headed. We conservatively attribute $60 billion, or roughly a quarter of the drop, to an increase in the risk that the government will weaken Microsoft’s property rights and harm future profitability.
To compensate for this increased risk, investors now demand a higher rate of return to hold Microsoft stock. More importantly, the price tag on the higher risk associated with Microsoft ($60 billion) is large enough to raise the return on U.S. corporate capital by six basis points.3 In other words, for investors to provide any given amount of capital, they must receive a higher rate of return than before. As a result, the entire supply of corporate capital shifts back and to the left, depicted in Figure 2 as the move from SupplyO to SupplyM.
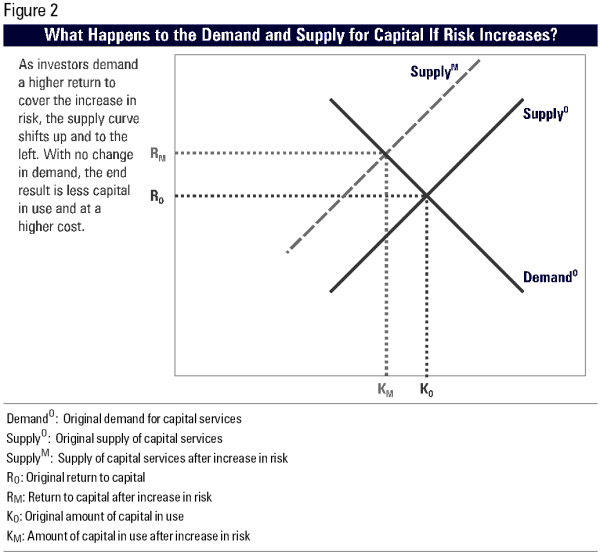
While this higher return compensates investors for the added risk, it raises costs to those who wish to employ capital in producing goods and services. The return businesses are willing to pay for differing amounts of capital services, or the demand for capital, depends on the productivity of capital and labor and on the prices they can charge for what gets produced.4 Because nothing has happened to change that demand, shown in Figure 2 as DemandO, the higher return that must now be paid to capital inevitably leads to less capital being put into use. In Figure 2, at the original rate of return, RO, businesses had been willing to employ KO units of capital. At the higher return, RM, however, it is cost effective to use the lower amount of capital, KM.
This reduction in capital will ripple through the economy. Less capital means that fewer workers will be needed. With less labor and less capital, the economy will produce less output. With less output, workers, savers and investors will receive lower incomes. The next section discusses our estimates of how large these economic costs might be.
Economic Costs of Increased Risk due to the Microsoft Decision
As just discussed, we have assumed that $60 billion, or about a fourth, of the drop in Microsoft’s market value since the start of a year is due to the increased risk stemming from the federal district court ruling. That $60 billion adds roughly 6 basis points to the return on corporate capital, which accounts for two-thirds of the U.S. stock of capital. Having to pay investors a higher return raises the cost of capital, resulting in less capital than would have been absent the higher risk.
We used our general equilibrium, neoclassical model to estimate how this increased risk would affect the economy.5 Table 1 shows the changes from the baseline (no increase in risk) for key economic variables after all the feedback effects have been taken into account.
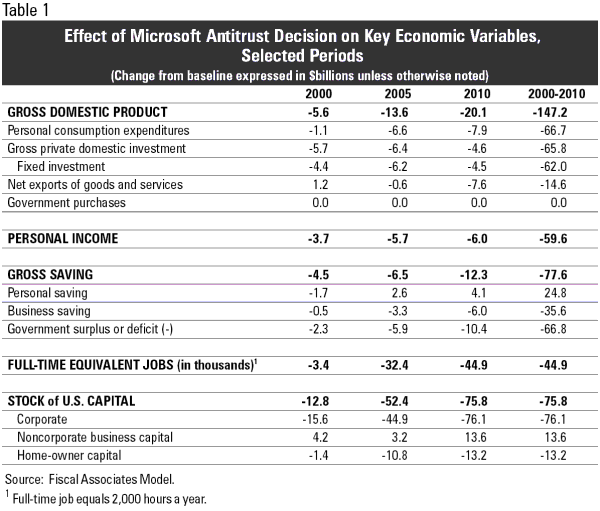
Summarizing results over the next eleven years (2000 to 2010):
- Gross domestic product would be lower by $147.2 billion. Most of that reduction would come out of consumption and investment.
- Investment, which makes up a little less than a fifth of GDP, would be hardest hit on a relative basis. The $65.8 billion drop in gross private domestic investment, which includes plant, equipment and software, would account for 45 percent of the loss in GDP.
- Consumer spending, which makes up two-thirds of GDP, would be lower by $66.7 billion.
- The higher cost of capital would disadvantage goods and services produced in the U.S. relative to the rest of the world. As a result, the U.S. would export $14.6 billion less than otherwise.
- With U.S. production down, workers, investors, savers and entrepreneurs would earn less. Personal income would be lower by $59.6 billion.
- Gross saving, which includes individuals, businesses and government, would fall by $77.6 billion. Most would come from a $66.8 billion drop in government surpluses thanks to lower tax revenues, as discussed below. Business saving, which is comprised of retained earnings and capital consumption allowances, would be lower by $35.6 billion because of less corporate investment. Personal saving would be $24.8 billion higher principally due to the increase in non-corporate capital.
- The slower economy would mean fewer hours worked. On a full-time equivalent basis (2000 hours per year), the economy would create 44,900 fewer jobs.
- Less investment would mean fewer computers, machinery, and buildings. The stock of U.S. corporate capital would be lower by $76.1 billion and owner-occupied housing by $13.2 billion. Non-corporate capital would increase by $13.6 billion because it would no longer pay many businesses to incorporate. The reason: The Microsoft decision calls into question an important benefit from incorporation – the ability to protect intellectual capital.
- Slower economic growth means a lower standard of living than otherwise. Over the eleven-year period, the loss in GDP would amount to $507 for every man, woman and child. and $1,293 for the average American household.6
By 2010, all the adjustments to the increased risk to corporate capital should have worked their way through the economy, leaving the long-run effects. Looking at the results for 2010, a somewhat different pattern emerges for some parts of the economy compared to the eleven-year adjustment period. In 2010:
- The annual loss in GDP would amount to $20.1 billion. While investment bore the brunt during the adjustment period, the trade sector would be the biggest loser in the long run. Because of the higher cost of capital, annual U.S. exports would be $7.6 billion lower than otherwise.
- Consumer spending would be lower by $7.9 billion a year while investment would be off by $4.6 billion.
- In the long run, personal income would be lower by $6 billion a year. While personal saving would be up by $4.1 billion, business saving would be lower by $6 billion. Lower tax revenues would shave $10.4 billion off government surpluses annually.
- Annual reductions in the standard of living would amount to $67 per capita and $171 for the average American household.
Lower Growth Affects the Government’s Bottom Line
Anything that affects the economy affects the government’s bottom line. Government at all levels currently takes a little over 30 percent of GDP in taxes. Federal receipts claim 20.2 percent while those of states and localities amount to 9.9 percent. Because marginal tax rates are higher than average rates, changes in GDP affect government receipts to an even greater degree.
The slower growth induced by increased risk would reduce government receipts in two ways. First, a smaller amount of GDP means a smaller tax base. In addition, because people would move down in the rate brackets due to lower incomes, a lower tax rate would apply to the smaller tax base.
Table 2 shows the changes from the baseline (no increase in risk) for government receipts and surpluses or deficits.
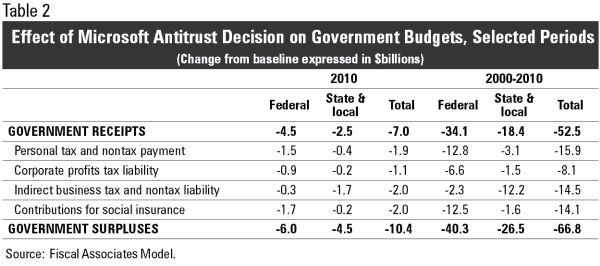
Summarizing aggregated results over next decade (2000 to 2010):
- Governments at all levels would take in $52.5 billion less in taxes.
- Federal receipts would be lower by $34.1 billion. Almost three-fourths of the loss would come from personal income taxes ($12.8 billion) and payroll taxes ($12.5 billion). The $6.6 billion less in corporate income taxes would account for about a fifth of loss with the $2.3 billion in reduced excise taxes making up the rest.
- State and local governments would collect $18.4 billion less revenue. Two-thirds of the loss would come out of indirect business taxes ($12.2 billion), mainly sales and property taxes. Personal income taxes ($3.1 billion), payroll taxes ($1.6 billion) and corporate income taxes ($1.5 billion) would make up the remainder.
- Lower tax revenue and interest savings would shave $66.8 billion off government surpluses. Federal surpluses would be lower by $40.3 billion and those of states and localities by $26.5 billion.
Conclusion
The Microsoft case has already cast a long shadow over the economy. Investor fears over what might happen to the future profitability and viability of the software giant have increased risk and with it the cost of U.S. capital. If as little as a quarter of the $210 billion drop in Microsoft’s market value since the start of the year is a result of the antitrust lawsuit, government action will cost the average American $507 in foregone goods and services over the next eleven years.
Will it be worth it? Presumably, the government embarked on this course because it sees Microsoft as a threat to competition and reduced competition could mean higher software prices. The question that remains is: Will consumers of software save enough to justify the losses to everybody else?
Endnotes
- Microsoft reached its all-time high of $119.94 on December 30, 1999.
- Microsoft hit a 52-week low of $60.38 on May 26, 2000.
- One hundred basis points is worth one percentage point.
- The demand curve for capital is sometimes called the marginal efficiency of capital or the marginal value product of capital. It represents the value of the change in output resulting from using one more unit of capital while holding labor services constant.
- The Fiscal Associates Inc. Model incorporates taxes through their effects on the returns to labor and capital. Economic effects are expressed as a change from a baseline forecast that describes how the economy would perform without any change in policy. The Model baseline is derived from the January 2000 budget forecast prepared by the Congressional Budget Office, which assumes the U.S. economy will grow at a long-run, real rate of 2.7 percent a year. For more on the Model see Gary and Aldona Robbins, Accounting for Growth: Incorporating Dynamic Analysis into Revenue Estimation, Institute for Policy Innovation, Policy Report No. 138, July 1996.
- Under its middle series, the Census projects the U.S. population will grow from 275.3 million in 2000 to 299.9 million in 2010. The average size of household is assumed to be 2.55. U.S. Census Bureau, “Annual Projections of the Total Resident Population as of July 1: Middle, Lowest, Highest and Zero International Migration Series, 1999 to 2100, February 14, 2000.