The mention of tax reform makes most people think of the personal income tax. But there is another tax—the payroll tax—that is just as important. Federal, state and local governments levy payroll taxes on wages and salaries to fund benefits for retirement, disability, and unemployment. As these social insurance programs have grown, so has the importance of payroll taxes.
A Brief Overview of Social Security
The largest payroll tax is perhaps best known by the acronym FICA, which stands for the Federal Insurance Contributions Act. FICA taxes pay for an elaborate federal system of retirement, survivors, disability and hospital benefits. The term “Social Security” usually encompasses the first three purposes but is really two separate programs. Old-Age and Survivors Insurance (OASI) pays benefits to retired workers and their families while Disability Insurance (DI) pays benefits to disabled workers and their families. Those receiving retirement and disability benefits are eligible for hospital insurance (HI) benefits, known as Medicare Part A.1 Old-age, survivors and disability benefits (OASDI) are financed through a 12.4 percent payroll tax. Although nominally split between employer and employee, the entire tax rate must be paid out of labor compensation.2 The tax applies to workers’ wages and salaries in covered employment called the wage base, which is indexed to wage growth.3 The OASDI wage base for calendar year 2001 is the first $80,400 of earnings in covered employment. A 2.9 percent tax on all wages and salaries goes to pay for Part A of Medicare.4
A second source of revenue comes from federal income taxes on Social Security benefits. Since 1984, single Social Security recipients with incomes above $25,000 and couples filing joint returns with incomes above $32,000 have had to include up to one-half of their benefits in adjusted gross income (AGI). These income taxes are credited to the Social Security trust fund. Since 1993, singles with incomes over $34,000 and couples over $44,000 have had to include up to 85 percent of their benefits in AGI. This added tax revenue goes to the trust fund for Medicare Part A.
Social Security and Medicare operate on a pay-as-you-go basis. Benefits disbursed in any one year are paid from tax revenues collected in that same year. When more payroll tax revenue comes in than benefits go out, the government borrows the surplus Social Security or Medicare taxes, credits the appropriate trust fund with a government bond, and tallies the amount “borrowed” with a special accounting device called a special issue bond. Unlike other bonds whose value fluctuate with changes in interest rates, special issues may always be redeemed at face value. Each year, the appropriate trust fund is also credited with accrued interest on the accumulated trust fund balance, also in the form of special issue bonds. In other words, Social Security’s assets consist solely of federal debt. When payroll taxes fall short of benefits, the government redeems the special issues held by the trust fund with tax dollars from general revenue.
Social Security is currently in surplus; that is, it takes in more tax revenue than it pays out in benefits. In a few more years, when the baby boom generation (those born between 1946 and 1963) begins to retire, Social Security is projected to face ever-widening deficits. It is this concern that has been driving calls for reform.
The Financial Outlook of Social Security
The Social Security Trustees issue an annual report on the financial condition of the system. There are six members of the Board of Trustees: the Secretary of Treasury, who serves as Managing Trustee; the Secretary of Health and Human Services; the Secretary of Labor; the Commissioner of Social Security; and two public trustees, who are appointed by the President and confirmed by the Senate to four-year terms.
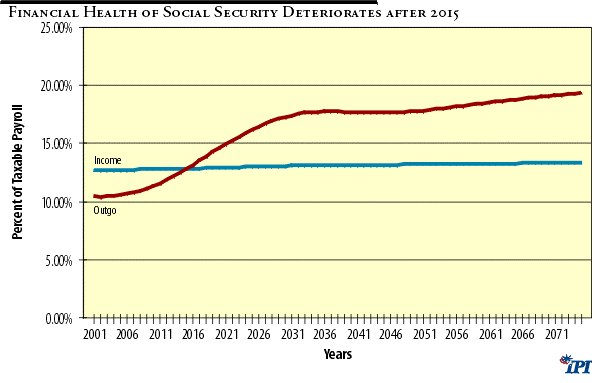
The annual report, issued in April, makes 75-year projections of the income, outgo and trust fund balances for OASDI programs. According to the 2001 Trustees’ report, Social Security will take more in taxes than are needed to pay benefits in each of the next fifteen years. Treasury bonds held by the combined OASDI trust fund should climb from the little over $1 trillion at the end of last year to $4.9 trillion ($3.1 trillion after inflation) in 2015. 5
Thereafter, however, the Trustees project payroll tax revenue coming into Social Security will fall short of money going out. As growing numbers of baby boomers reach retirement age, the payroll taxes collected from workers along with the income taxes on Social Security benefits will no longer be enough to cover the checks sent to beneficiaries. The Trustees project these annual operating deficits to start out small–about $18 billion in today’s dollars–but expand at a rate of 6.5 percent a year, after inflation. Figure 1 depicts the near-term surpluses, which become widening deficits as a percent of taxable payroll.
Figure 1
What could mounting Social Security deficits mean for future workers and retirees? As Table 1 shows, closing the deficits with taxes would eventually add up to six percentage points onto the current OASDI payroll tax rate of 12.4 percent. For a worker earning the average wage, the extra taxes needed to cover the first deficit year would amount to $129 (in 2001 dollars). Within five years those extra taxes would more than quintuple to $720 annually. Viewed from the payout side, projected deficits would amount to a fifth of benefits in 2020, rising to almost a third by 2075.
Table 1
How Much Would Taxes Have to be Raised or Benefits Cut to Eliminate Social Security Operating Deficits1
|
Year
|
Average Wage
|
Added Tax
|
as %
|
Average Benefit
|
Reduction in Benefits
|
as %
|
|
(Intermediate assumptions; amounts in $2001)
|
||||||
|
2016
|
39,471
|
129
|
0.3%
|
11,453
|
284
|
2%
|
|
2017
|
39,845
|
271
|
0.7%
|
11,615
|
584
|
5%
|
|
2018
|
40,237
|
418
|
1.0%
|
11,776
|
881
|
7%
|
|
2019
|
40,620
|
568
|
1.4%
|
11,934
|
1,170
|
10%
|
|
2020
|
41,013
|
720
|
1.8%
|
12,091
|
1,450
|
12%
|
|
2025
|
43,037
|
1,391
|
3.2%
|
12,754
|
2,544
|
20%
|
|
2030
|
45,162
|
1,910
|
4.2%
|
13,413
|
3,284
|
24%
|
|
2035
|
47,388
|
2,200
|
4.6%
|
14,066
|
3,682
|
26%
|
|
2040
|
49,732
|
2,263
|
4.6%
|
14,717
|
3,781
|
26%
|
|
2045
|
52,186
|
2,343
|
4.5%
|
15,364
|
3,904
|
25%
|
|
2050
|
54,758
|
2,513
|
4.6%
|
16,075
|
4,147
|
26%
|
|
2055
|
57,464
|
2,798
|
4.9%
|
16,832
|
4,529
|
27%
|
|
2060
|
60,299
|
3,136
|
5.2%
|
17,649
|
4,971
|
28%
|
|
2065
|
63,273
|
3,480
|
5.5%
|
18,508
|
5,418
|
29%
|
|
2070
|
66,394
|
3,838
|
5.8%
|
19,413
|
5,878
|
30%
|
|
2075
|
69,673
|
4,215
|
6.1%
|
20,369
|
6,356
|
31%
|
| Source: Derived from The 2001 Annual Report of the Board of Trustees of the Federal Old-Age and Survivors Insurance and Disability Insurance Trust Funds, Washington, DC, March 19, 2001, Tables IV.B1, IV.B2, VI.E7 and VI.E8.
1Operating deficit is the difference between annual income from payroll taxes and income taxation of benefits and annual benefit payments. Excludes trust fund interest. |
||||||
A natural reaction is: What is the problem? Simply cash in some of the trillions of dollars in bonds held by the OASDI trust fund. The problem is Treasury bonds are not like private sector stocks and bonds whose value derives from the ability of companies to produce and sell goods and services in the future. In contrast, the value of Treasury bonds depends on the ability of government to collect taxes from the private sector. To come up with the cash to redeem trust fund bonds, the federal government will have to raise payroll taxes, reduce benefits, raise other taxes, cut spending somewhere else, borrow from the public, or some combination of these. That could prove especially difficult because other programs, particularly entitlements, are projected to continue expanding. Medicare, the second-largest entitlement, will eventually run deficits even larger than Social Security.6
The Economy and Social Security
Social Security’s future is highly sensitive to the economy. In general, the stronger the economy, the better off is Social Security. A faster-growing economy usually means more workers with jobs at higher wages, which, in turn, means higher payroll tax collections. A low-inflation climate helps restrain program costs because benefits receive smaller cost-of-living adjustments. Of course, because benefits are linked to wages, faster growth also can raise future program costs.
The future is uncertain, so the Trustees present three scenarios based on different assumptions about the economy and demographic trends. The intermediate scenario is thought to be the “best guess” and generally forms the basis for policy changes. The low-cost scenario assumes economic and demographic conditions more favorable to Social Security and the high-cost scenario less-favorable conditions. Table 2 shows the range of assumptions used in the latest report for three important economic indicators—economic growth, real-wage growth and inflation.
Table 2
Key Economic Assumptions Underlying Social Security Projections
|
Variable
|
Intermediate
|
Low-Cost
|
High-Cost
|
Actual
|
| Economic growth1 | ||||
| Short-run2 |
2.0%
|
2.6%
|
1.2%
|
3.3%
|
| Long-run3 |
1.5%
|
2.2%
|
0.8%
|
3.5%
|
| Real Wage growth4 | ||||
| Short-run |
1.2%
|
1.6%
|
0.5%
|
1.2%
|
| Long-run |
1.0%
|
1.5%
|
0.5%
|
1.1%
|
| Inflation5 | ||||
| Short-run |
3.2%
|
2.4%
|
4.3%
|
2.8%
|
| Long-run |
3.3%
|
2.3%
|
4.3%
|
3.3%
|
| Source: Derived from The 2001 Annual Report of the Board of Trustees of the Federal Old-Age and Survivors Insurance and Disability Insurance Trust Funds, Washington, DC, March 19, 2001, Table VI.E7.
1 Compounded, average annual percent change in real GDP. Actual uses real GDP for 1990 through 2000 from the National Income and Product Accounts, July 2000 release, March 29, 2001 update. 2 Short-run covers the period 2000 to 2010 for the Trustees’ forecasts, 1990 to 2000 for actual economic growth and inflation, and 1990 to 1998 for real wage growth. 3 Long-run covers the period 2010 to 2075 for the Trustees’ forecasts, 1929 to 2000 for actual economic growth and inflation and 1951 to 1998 for actual real wage growth. 4 Compounded, average annual percent change in the SSA average wage index adjusted for inflation. 5 Compounded, average annual percent change in the Consumer Price Index. |
||||
Under the intermediate scenario, the Trustees assume that the economy will average 2 percent annual growth, after inflation, for the next ten years. For the rest of the projection period (2010 to 2075), the Trustees assume the growth rate will slow to 1.5 percent. Average wages after inflation are assumed to increase 1.2 percent a year over the next ten years and 1.1 percent over the long run. The Trustees expect inflation to average 3.2 percent a year until 2010 and 3.3 percent thereafter. The low-cost scenario contains higher growth and lower inflation while the high-cost scenario assumes the opposite.
The problem with the Trustees’ scenarios is that too many factors change at the same time. Besides higher growth, the low-cost scenario assumes higher rates of fertility, mortality, morbidity and immigration than does the intermediate case. A larger and younger population increases tax revenues more than it increases program costs. The less-favorable, high-cost scenario assumes lower rates for these demographic variables.
To better understand the economy’s role in Social Security, it is necessary to isolate economic factors. Each year the Trustees perform sensitivity analysis for several key factors in which only one variable is changed at a time. According to the 2001 Report, if wages after inflation grew at one percent a year instead of only 0.5 percent, the average deficit over 75 years would decline from 2.36 percent to 1.86 percent of taxable payroll. Real-wage growth of 1.5 percent a year would further lower the 75-year deficit to 1.35 percent.7
Policy simulation results shown in Table 3 confirm that a healthy economy makes for a healthy Social Security. The table reports the levels of Social Security income and outgo for the intermediate assumptions in the Trustees’ report, labeled “baseline,” and two other scenarios. The second policy simulation replaces the growth and inflation assumptions in the Trustees’ intermediate case with those of the Congressional Budget Office (CBO).8 Instead of the Trustees’ 2 percent growth and 3.2 percent inflation in the short run, CBO has the economy growing at 3 percent and prices at 2.6 percent. By 2010, CBO long-run growth stabilizes at 3.1 percent and inflation at 2.5 percent in contrast to the Trustees’ more pessimistic 1.5 percent growth and 3.3 percent inflation.
Table 3
Social Security Benefits from Higher Growth and Lower Inflation
|
Year
|
Income without interest1
|
Outgo
|
||||
|
(in billions of dollars)
|
||||||
|
Baseline2
|
CBO3
|
Growth4
|
Baseline2
|
CBO3
|
Growth4
|
|
|
2001
|
532
|
532
|
559
|
439
|
439
|
458
|
|
2002
|
560
|
557
|
600
|
460
|
458
|
481
|
|
2003
|
589
|
587
|
640
|
484
|
481
|
505
|
|
2004
|
618
|
615
|
683
|
510
|
504
|
530
|
|
2005
|
650
|
645
|
725
|
540
|
530
|
558
|
|
2006
|
682
|
674
|
774
|
572
|
557
|
589
|
|
2007
|
717
|
707
|
820
|
607
|
588
|
625
|
|
2008
|
753
|
740
|
867
|
646
|
621
|
666
|
|
2009
|
791
|
776
|
913
|
690
|
659
|
712
|
|
2010
|
831
|
814
|
961
|
738
|
700
|
764
|
|
2015
|
1,059
|
1,036
|
1,224
|
1,058
|
978
|
1,116
|
|
2020
|
1,336
|
1,317
|
1,570
|
1,518
|
1,379
|
1,618
|
|
2025
|
1,683
|
1,677
|
2,021
|
2,103
|
1,891
|
2,253
|
|
2030
|
2,121
|
2,133
|
2,591
|
2,808
|
2,515
|
3,016
|
|
2035
|
2,676
|
2,706
|
3,304
|
3,624
|
3,240
|
3,888
|
|
2040
|
3,379
|
3,437
|
4,217
|
4,548
|
4,070
|
4,894
|
|
2045
|
4,244
|
4,350
|
5,385
|
5,690
|
5,123
|
6,175
|
|
2050
|
5,314
|
5,507
|
6,895
|
7,162
|
6,509
|
7,859
|
|
2055
|
6,648
|
6,976
|
8,853
|
9,095
|
8,357
|
10,107
|
|
2060
|
8,314
|
8,838
|
11,359
|
11,575
|
10,747
|
12,993
|
|
2065
|
10,399
|
11,196
|
14,576
|
14,703
|
13,780
|
16,649
|
|
2070
|
12,993
|
14,173
|
18,697
|
18,635
|
17,639
|
21,314
|
|
2075
|
16,233
|
17,955
|
22,839
|
23,595
|
22,599
|
25,989
|
| % change relative to baseline |
10.6%
|
40.7%
|
-4.2%
|
10.1%
|
||
| Source: Policy simulations performed using the Fiscal Associates Model.
1 Payroll taxes and income taxes on social security benefits. 2 Intermediate assumptions from The 2001 Annual Report of the Board of Trustees of the Federal Old-Age and Survivors Insurance and Disability Insurance Trust Funds, Washington, DC, March 19, 2001. 3 Between 2001 and 2010, the economy grows at 3 percent and prices at 2.6 percent. Long-run growth stabilizes at 3.1 percent and inflation at 2.5 percent. See Congressional Budget Office, The Economic and Budget Outlook, Fiscal Year 2002, January 2001. 4 Assumes growth would average 4.4% between 2001 and 2010 and 3.1% thereafter. From 2012, real GDP would be 15 percent higher than under the CBO assumptions. |
||||||
Adopting the CBO growth and inflation assumptions improves Social Security’ ;s financial outlook considerably. By 2075, higher growth and lower inflation would increase Social Security tax revenues by 10.6 percent and lower costs by 4.2 percent compared to the baseline. Using trust fund assets at the end of the year, Table 4 shows that using the CBO growth and inflation assumptions cuts the present value of Social Security deficits over the next 75 years in half, from $3.2 trillion to $1.5 trillion.
Table 4
Present Value of Social Security Trust Fund
|
Year
|
Assets at end of year1
(in billions of dollars) |
||
|
Baseline2
|
CBO3
|
Growth4
|
|
|
2001
|
1,215
|
1,215
|
1,397
|
|
2002
|
1,397
|
1,395
|
1,606
|
|
2003
|
1,595
|
1,591
|
1,842
|
|
2004
|
1,807
|
1,801
|
2,106
|
|
2005
|
2,035
|
2,025
|
2,397
|
|
2006
|
2,278
|
2,262
|
2,721
|
|
2007
|
2,536
|
2,513
|
3,075
|
|
2008
|
2,806
|
2,779
|
3,454
|
|
2009
|
3,088
|
3,057
|
3,855
|
|
2010
|
3,379
|
3,348
|
4,276
|
|
2015
|
4,889
|
4,927
|
6,518
|
|
2020
|
6,099
|
6,469
|
8,728
|
|
2025
|
6,510
|
7,714
|
10,677
|
|
2030
|
5,602
|
8,438
|
12,174
|
|
2035
|
2,847
|
8,483
|
13,142
|
|
2040
|
-2,239
|
7,876
|
13,773
|
|
2045
|
-10,546
|
6,430
|
14,046
|
|
2050
|
-23,802
|
3,462
|
13,588
|
|
2055
|
-44,721
|
-2,190
|
11,642
|
|
2060
|
-77,288
|
-12,279
|
11,359
|
|
2065
|
-126,944
|
-29,034
|
-1,171
|
|
2070
|
-201,332
|
-55,561
|
-14,910
|
|
2075
|
-311,329
|
-96,455
|
-36,562
|
| Present Value5 |
-3,214
|
-1,522
|
-496
|
| Source: Policy simulations performed using the Fiscal Associates Model.
1 Assets of combined OASI and DI trust fund. 2 Intermediate assumptions from The 2001 Annual Report of the Board of Trustees of the Federal Old-Age and Survivors Insurance and Disability Insurance Trust Funds, Washington, DC, March 19, 2001. 3 Between 2001 and 2010, the economy grows at 3 percent and prices at 2.6 percent. Long-run growth stabilizes at 3.1 percent and inflation at 2.5 percent. See Congressional Budget Office, The Economic and Budget Outlook, Fiscal Year 2002, January 2001. 4 Assumes growth would average 4.4% between 2001 and 2010 and 3.1% thereafter. From 2012, real GDP would be 15 percent higher than under the CBO assumptions. 5 An effective interest rate of 6.35% is used for the baseline; 5.7% is used for the CBO and growth simulations, reflecting the lower inflation assumptions. |
|||
The third policy simulation assumes that economic growth would average 4.4 percent over the next ten years before settling down to 3.1 percent. From 2012 on, the level of real GDP would be 15 percent higher than in the CBO scenario. By 2075, the temporary boost to short-run growth would produce Social Security tax revenues 40.7 percent higher than in the Trustees’ intermediate scenario. A faster-growing economy also would mean that benefits, indexed to the growth in wages, would be higher. However, tax revenues would increase three times as much as the 10.1 percent rise in benefits, reducing the present value of Social Security trust fund deficits over the next 75 years by 85 percent to $496 billion.
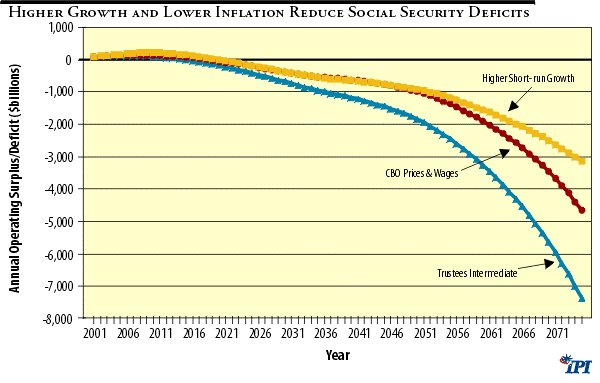
While a stronger economy definitely helps Social Security, the program still would run widening out-year deficits under both the CBO and higher-growth policy simulations. However, as Figure 2 shows, those deficits would begin somewhat later than in the Trustees’ intermediate case and would be considerably smaller. Only time will tell which, if any, of these scenarios proves close to reality. But there is no question that a faster-growing, lower-inflation economy would lessen the financial strain imposed by Social Security.
Figure 2
Social Security as “Social” Insurance
Social Security is commonly perceived as providing workers a return on their tax “contributions” when they retire. This return is in the form of a monthly benefit based on the earnings that were taxed during a person’s working career. However, this relationship is not one-to-one because of the program’s social insurance aspect, which falls into two broad categories. The first is a progressive benefit formula that rewards lower-wage workers more than higher-wage workers. The other is a complex network of transfers that pays some beneficiaries based on the earnings history of another worker.
A Progressive Benefit Formula
Benefits for a retiring worker who has paid payroll taxes for at least 40 quarters are based on the highest 35 years of earnings. 9 Those earnings are adjusted using a special index for wage growth between the year the worker earned them and the year in which he or she turned age 60. 10 For example, suppose a worker age 60 in 1995 had earned $5,000 in 1970. Using the wage index to reflect wage growth over that period, the worker’s 1970 earnings would be increased to $19,968 for the purpose of determining benefits. 11
After being indexed, the 35 highest-earning years are averaged to come up with the Average Indexed Monthly Earnings (AIME). The basic benefit, or primary insurance amount (PIA), is determined by the following formula:
PIA = 90% of the first $561 of AIME
plus 32% of AIME in excess of $561 but less than $3,381
plus 15% of AIME over $3,381.
The dollar amounts ($562 and $3,381), called bend points, are adjusted each year for the growth in average wages. The values given in the formula above apply to workers retiring in 2001.12
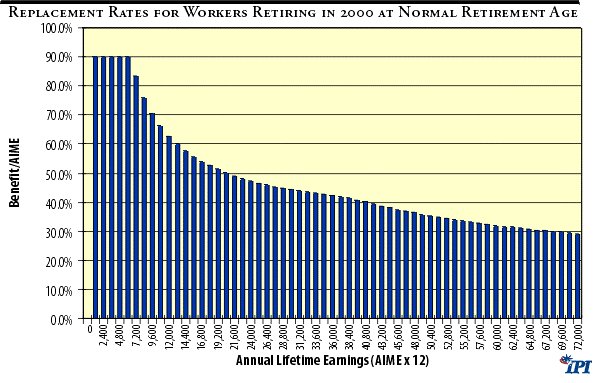
Under a one-to-one correspondence between “contributions” and benefits, the PIA would be a flat percentage of the retiring worker’s lifetime earnings. But, just like the income tax, Social Security’s benefit formula is progressive. Workers with AIME up to $561 ($6,732 annually) receive a benefit equal to 90 percent of that AIME. The rate of replacement on earnings above $561 drops first to 32 percent and then to 15 percent. In other words, workers with higher lifetime earnings receive a lower return from Social Security.13
Figure 3 shows the replacement rates for retiring workers over a range of average lifetime earnings. Replacement rates gradually diminish from 90 percent of average lifetime earnings for the lowest-paid workers to about 40 percent for average workers to less than 30 percent for the highest-paid workers.
Figure 3
Because policy discussions often focus on the so-called “average-wage worker,” there may be a tendency to think that most workers fall into that category. But a cursory look at data on recently retired workers suggests this may not be the case. Table 5 shows the distribution of the almost 1.7 million workers who retired in 1999 by PIA. Another source indicates more than 70 percent opted to retire between the ages of 62 and 64, accepting as much as a 20 percent reduction in PIA.14 Three-quarters of those retiring early did so at age 62.15
Columns labeled “Replacement Rate” express the primary insurance amount as a percent of average indexed monthly earnings.16 To put the results in better perspective, it is helpful to know the value of this replacement rate for the hypothetical “average-wage worker” often used in Social Security analysis.17 This worker, who always earns the average Social Security wage, would have earned almost $30,500 in 1999.18 For an average-wage worker retiring at 65 in 1999, the PIA would amount to $935 and replace 47 percent of the AIME. The PIA of an average-wage worker retiring early at 62 would be $1,025, replacing 45 percent of the AIME.19
As Table 5 shows, a little over half the workers retiring at age 65 had PIAs less than that of the hypothetical average-wage worker. Perhaps more striking, a surprisingly large share of workers–16.7 percent retiring at the normal retirement age and 13.9 percent retiring early–had the minimum replacement rate of 90 percent because their average lifetime earnings did not reach the first bend point.20 At the top of the distribution (PIAs of $1,500 or more), there were only 9,000 workers, representing only 0.7 percent of all early retirees.21
Table 5
Distribution of Primary Insurance Amounts for Newly-Retired Workers, December 19991
|
Primary Insurance Amount
|
Without early retirement reduction
|
With early retirement reduction
|
||||||
|
(thous)
|
Percent
|
Cumulative
|
Replacement Rate2
|
(thous)
|
Percent
|
Cumulative
|
Replacement Rate3
|
|
| Less than $350.00 |
38
|
7.9%
|
7.9%
|
90%
|
118
|
9.8%
|
9.8%
|
90%
|
| $350.00 to $399.90 |
8
|
1.6%
|
9.5%
|
90%
|
25
|
2.1%
|
11.9%
|
90%
|
| $400.00 to $449.90 |
15
|
3.1%
|
12.6%
|
90%
|
25
|
2.0%
|
13.9%
|
90%
|
| $450.00 to $499.90 |
20
|
4.1%
|
16.7%
|
90%
|
58
|
4.8%
|
18.7%
|
66%
|
| $500.00 to $549.90 |
20
|
4.2%
|
20.9%
|
72%
|
59
|
4.9%
|
23.6%
|
60%
|
| $550.00 to $599.90 |
22
|
4.5%
|
25.4%
|
65%
|
56
|
4.6%
|
28.2%
|
56%
|
| $600.00 to $649.90 |
20
|
4.2%
|
29.6%
|
60%
|
55
|
4.6%
|
32.8%
|
53%
|
| $650.00 to $699.90 |
21
|
4.4%
|
34.0%
|
57%
|
52
|
4.4%
|
37.2%
|
50%
|
| $700.00 to $749.90 |
21
|
4.4%
|
38.4%
|
54%
|
46
|
3.8%
|
41.0%
|
48%
|
| $750.00 to $799.90 |
22
|
4.5%
|
42.9%
|
51%
|
45
|
3.8%
|
44.8%
|
47%
|
| $800.00 to $849.90 |
19
|
4.0%
|
46.9%
|
50%
|
43
|
3.6%
|
48.4%
|
45%
|
| $850.00 to $899.90 |
20
|
4.2%
|
51.1%
|
48%
|
40
|
3.3%
|
51.7%
|
44%
|
| $900.00 to $949.90 |
20
|
4.1%
|
55.2%
|
47%
|
42
|
3.5%
|
55.2%
|
43%
|
| $950.00 to $999.90 |
19
|
3.8%
|
59.0%
|
46%
|
38
|
3.2%
|
58.4%
|
43%
|
| $1,000.00 to $1,049.90 |
20
|
4.1%
|
63.1%
|
45%
|
39
|
3.3%
|
61.7%
|
42%
|
| $1,050.00 to $1,099.90 |
17
|
3.4%
|
66.5%
|
44%
|
39
|
3.3%
|
65.0%
|
41%
|
| $1,100.00 to $1,149.90 |
18
|
3.7%
|
70.2%
|
43%
|
41
|
3.4%
|
68.4%
|
41%
|
| $1,150.00 to $1,199.90 |
21
|
4.3%
|
74.5%
|
43%
|
40
|
3.3%
|
71.7%
|
40%
|
| $1,200.00 to $1,249.90 |
29
|
6.1%
|
80.6%
|
42%
|
47
|
3.9%
|
75.6%
|
40%
|
| $1,250.00 to $1,299.90 |
24
|
4.9%
|
85.5%
|
42%
|
53
|
4.4%
|
80.0%
|
40%
|
| $1,300.00 to $1,349.90 |
25
|
5.2%
|
90.7%
|
41%
|
73
|
6.1%
|
86.1%
|
39%
|
| $1,350.00 to $1,399.90 |
29
|
6.1%
|
96.8%
|
41%
|
66
|
5.5%
|
91.7%
|
39%
|
| $1,400.00 to $1,449.90 |
15
|
3.1%
|
99.9%
|
40%
|
55
|
4.6%
|
96.3%
|
39%
|
| $1,450.00 to $1,499.90 |
0
|
0.0%
|
99.9%
|
40%
|
33
|
2.8%
|
99.1%
|
38%
|
| $1,500.00 or more |
0
|
0.0%
|
99.9%
|
9
|
0.7%
|
99.8%
|
||
| Total |
482
|
1,196
|
||||||
| Source: Social Security Administration, Annual Statistical Supplement, 2000, Tables 6.B4 and unpublished table prepared by the Office of the Actuary, June 2001.
1 An award is the term which describes the addition of someone to the Social Security benefit rolls. Awards, which are counted monthly, include not only new entrants to the benefit rolls but also people already on the rolls whose benefits in one category are converted to another category. For example, upon reaching age 65, a disabled worker becomes a retired worker. 2 The primary insurance amount (PIA) for the class midpoint divided by the implied average indexed monthly earnings (AIME). The AIME was computed using the 1999 benefit formula for a retiring worker: PIA = 90% of the AIME up to $505; plus 32% of the AIME between $505 and $3,043; plus 15% of the AIME over $3,043. 3 In 1999, the PIA was reduced by 5/9ths of 1% for every month if the worker retired before age 65 up to a maximum of 20%. The replacement rates listed under early retirement correct for the full 20% reduction. |
||||||||
Although the tendency may be to view wages as distributed somewhat evenly from low to high, that may not be the case. Indeed, these results suggest that lifetime earnings may be lower and the redistribution within Social Security higher for more retirees than generally recognized. If true, that would pose one more hurdle to any reform measure making retirement benefits less progressive than the current system.
Dependents of Retired Workers
Besides retired workers who paid payroll taxes all their working lives, Social Security also pays benefits to eligible dependents. Table 6 summarizes the eligibility requirements and benefits for these and other categories of Social Security beneficiaries.
Table 6
Who Qualifies for Retirement, Survivor and Disability Benefits?
|
Type of Benefit
|
Who Is Eligible
|
Value of Benefit
|
|
Retired Workers and Dependents
|
||
| Retired Worker | At least age 62 and worked in employment covered by FICA taxes long enough to be fully insured (usually 40 quarters) | Average of highest 35 years of earnings indexed for wage growth (AIME). The basic benefit or primary insurance amount is:1
PIA = 90% of the first $561 of AIME + 32% of AIME in excess of $561 but less than $3,381 + 15% of AIME in excess of $3,381 |
| Spouse of retired worker | At least age 62; or has a child under age 16; or has a disabled child in his or her care | 50% of retired worker PIA2 |
| Child | Child under age 18 (19 if attending elementary/secondary school full time); child 18 or older who was disabled before age 22 | 50% of retired worker PIA |
| Divorced spouse | At least age 62 and married at least 10 years to fully insured worker | 50% of retired worker PIA2 |
|
Survivors of Deceased Workers
|
||
| Young widowed mother or father | Widow(er) of fully or currently insured worker or divorced widow(er) and caring for an eligible child under age 16 or a disabled child.4 | 75% of insured worker PIA2,3 |
| Widow/Widower | At least age 60; or at least age 50 if disabled and widow(er) of fully insured worker; or divorced spouse married at least 10 years. | 100% of insured worker PIA2,3 |
| Child | Child under age 18 (19 if attending elementary/secondary school full time); child 18 or older who was disabled before age 22 | 75% of insured worker PIA3 |
| Parent | At least age 62 and was dependent on a fully insured worker | 82.5% of insured worker PIA, or 75% each if there are two parents3 |
|
Disabled Workers and Dependents
|
||
| Disabled Worker | Under age 65 and disability insured, which requires 20 quarters of coverage. | PIA of insured worker5 |
| Spouse of disabled worker | At least age 62; or has a child under age 16; or has a disabled child in his or her care | 50% of PIA of insured worker5 |
| Child | Child under age 18 (19 if attending elementary/secondary school full time); child 18 or older who was disabled before age 22 | 50% of PIA of insured worker5 |
| Source: U.S. Department of Health and Human Services, Social Security Administration, Office of the Actuary, History of the Provisions of Old-Age, Survivors, Disability and Health Insurance, 1935-1993, SSA Pub. No. 11-11515, June 1994.
1 The PIA is subsequently adjusted for early or delayed retirement and for inflation. Formula applies to workers retiring in 2001. 2 Benefit is reduced if spouse is receiving a pension from government employment not covered by Social Security. 3 Years used to determine AIME are years of coverage minus five. 4 Divorced widowed father must have been married 10 years. 5 Same formula as retired worker except years used to determine AIME are years of coverage less up to five dropout years. |
||
Children under 18 are eligible for benefits as are disabled children 18 and over whose disability began before the age 18. Husbands or wives of retired workers may be eligible if they are at least age 62 or if an entitled child is in their care. A divorced spouse who is at least 62 and was married to a retired worker at least 10 years also may be entitled to a benefit.
Eligible dependents can receive a benefit equal to as much as half that of the retired worker. Spouses qualifying for Social Security in their own right are guaranteed at least the spousal benefit. Total benefits to a family, however, are capped at an amount that usually falls between 150 percent and 188 percent of the worker’s primary insurance amount.22
As Table 7 shows, the 27.7 million retired workers at the end of December 1999 accounted for 62.3 percent of OASDI beneficiaries and 68.6 percent of OASDI benefits. Benefits were also paid to 2.8 million spouses and 442,000 children. These dependents accounted for 7.3 percent of OASDI beneficiaries and 4.1 percent of benefits.
Table 7
Who Receives Benefits from Social Security?
|
Beneficiaries and benefits by type, December 1999
|
||||||
|
Type of Benefit
|
Beneficiaries
|
Monthly Benefits
|
||||
|
Number (000)
|
Average Age
|
%Total
|
Amount ($000)
|
Average Benefit
|
%Total
|
|
| Total OASDI1 |
44,599
|
100.0%
|
32,579
|
731
|
100.0%
|
|
| OASI2 |
38,073
|
85.4%
|
28,547
|
750
|
87.6%
|
|
| Retired workers |
27,782
|
74
|
62.3%
|
22,342
|
804
|
68.6%
|
|
2,811
|
71
|
6.3%
|
1,157
|
412
|
3.6%
|
|
119
|
0.3%
|
49
|
409
|
0.1%
|
|
|
442
|
21
|
1.0%
|
165
|
373
|
0.5%
|
|
240
|
14
|
0.5%
|
82
|
340
|
0.3%
|
|
190
|
39
|
0.4%
|
78
|
413
|
0.2%
|
|
12
|
18
|
0.0%
|
5
|
417
|
0.0%
|
|
1,887
|
20
|
4.2%
|
991
|
525
|
3.0%
|
|
1,353
|
11
|
3.0%
|
695
|
514
|
2.1%
|
|
479
|
47
|
1.1%
|
264
|
551
|
0.8%
|
|
56
|
18
|
0.1%
|
33
|
593
|
0.1%
|
| Nondisabled widows and widowers |
4,739
|
76
|
10.6%
|
3,670
|
775
|
11.3%
|
| Widowed mothers and fathers |
212
|
43
|
0.5%
|
120
|
565
|
0.4%
|
| Disabled widows and widowers |
198
|
59
|
0.4%
|
99
|
500
|
0.3%
|
| Parents of deceased workers |
3
|
82
|
0.0%
|
2
|
675
|
0.0%
|
| DI3 |
6,526
|
14.6%
|
4,031
|
618
|
12.4%
|
|
| Disabled workers |
4,874
|
52
|
10.9%
|
3,678
|
755
|
11.3%
|
|
176
|
48
|
0.4%
|
34
|
191
|
0.1%
|
|
1,476
|
13
|
3.3%
|
319
|
216
|
1.0%
|
|
1,381
|
13
|
3.1%
|
290
|
210
|
0.9%
|
|
57
|
28
|
0.1%
|
18
|
311
|
0.1%
|
|
37
|
18
|
0.1%
|
12
|
318
|
0.0%
|
| Source: Social Security Administration, Annual Statistical Supplement, 2000, Tables 5.A1 & 5.A5.
1 Old-Age and Survivors Insurance and Disability Insurance programs. 2 Old-Age and Survivors Insurance. 3 Disability Insurance. |
||||||
Survivors of Deceased Workers
Surviving spouses who are at least 60 years of age are the largest group of survivors receiving benefits from Social Security. At the end of 1999, the 4.7 million widows and widowers of deceased workers accounted for 10.6 percent of OASDI beneficiaries and 11.3 percent of benefits. Next largest were 1.9 million surviving children who were 4.2 percent of beneficiaries and received 3 percent of benefits. The remaining categories of survivors–widowed mothers and fathers, disabled widows and widowers, and parents of deceased workers–made up less than one percent of OASDI beneficiaries and benefits.
Disabled Workers and Dependents
Since 1957, Social Security has insured against disability. Social Security defines disability as the inability to engage in substantial gainful activity because of physical or mental impairment expected to last at least a year or result in death. While the benefit formula is the same as that of retired workers, fewer years are used in the averaging process.23 At age 65, benefit funding switches from the Disability Insurance (DI) trust fund to the Old-Age and Survivors Insurance (OASI) trust fund. Because of this conversion, disabled workers make up about 15 percent of newly retired workers today and are projected to rise to 20 percent before the end of the decade. At the end of 1999, disabled workers accounted for 14.6 percent of OASDI beneficiaries and 12.4 percent of benefits. The average age of disabled workers is 52 and the average monthly benefit is $755, less than the $804 average for retired workers.
Spouses, divorced spouses, and children of disabled workers also may receive benefits from Social Security. Children under 18 are eligible as are disabled persons whose disability began before the age 18 and while one parent was receiving a disability benefit. Husbands or wives of disabled workers may be eligible if they are at least age 62 or if an entitled child is in their care. As Table 7 shows, dependents of disabled workers made up 3.7 percent of OASDI beneficiaries and received 1.1 percent of benefits at the end of 1999.
Implications for Social Security Reform
The “social insurance” aspect of Social Security complicates reform. Depending on family relationships, two workers with the same wage history can receive dramatically different benefits. For example, suppose a single worker retired at age 65 in 2000 with a monthly Social Security benefit of $900. Now suppose another worker with the same benefit has a spouse who does not qualify for Social Security on his or her own. The couple would receive $1,350 a month–$900 for the retired worker and $450 for the spouse. If the couple has a child under the age of 18, the family benefit would amount to $1,600. 24 If the retired worker had been married before for ten years, the divorced spouse also could receive $450 in monthly benefits.
These two examples illustrate how Social Security could pay out benefits ranging from $900 to $2,050 on the basis of one worker’s earnings history. In the case of the single worker, changing the retirement benefit would affect only the worker. In the case of the married worker, change could affect two or more people.
Reforming Social Security
Consensus has been forming over the last several years to change at least part of Social Security financing. Since it began in the 1930s, Social Security has used the payroll taxes collected from those working to pay benefits to those who are retired. Pay-as-you-go funding was adopted during the Great Depression when the objective was to entice older workers to retire by giving them a government pension. There were plenty of workers and few retirees, so initially tax rates were modest–2 percent of the first $3,000 in wages ($31,000 in today’s dollars).25
Tax rates, however, did not stay low for long. As benefits were added or expanded and as the ratio of workers to beneficiaries has fallen, Social Security payroll taxes have had to increase as well.26 As discussed earlier, the Trustees’ “best guess” is that today’s 12.4 percent tax rate will not be enough to pay for benefits promised to future retirees. Even worse, the gap between payroll tax revenues and benefits will widen with each succeeding generation.
There is widespread agreement that something must be done. While consensus over what that “something” should be is far from universal, approaches to reform are congealing into three broad categories: status quo, modest reform and more sweeping reform.
Status Quo
The status quo would attempt to keep Social Security financing pretty much as it is—pay-as-you-go. To handle projected deficits, it would advocate a mixture of tax increases and benefit reductions. On the tax side, a commonly cited proposal would be to collect more taxes from the highest-wage workers by getting rid of the OASDI wage ceiling, as was done with Hospital Insurance in 1993. On the benefit side, raising the retirement age and limiting cost-of-living adjustments have been perennial favorites. While some in the status quo camp might allow trust fund assets to be invested in more than just Treasury bonds, that investment would remain under the strict control of government as opposed to private parties or individuals.
Reformers, on the other hand, look to personalize and prefund Social Security. That is, benefits in the future would be at least partially paid out of assets and the return on those assets, accumulating in accounts belonging to individual workers. The main difference between modest and more sweeping reformers is the degree of prefunding.
Modest Reform
Modest reformers advocate redirecting a portion of the Social Security payroll tax rate into individual accounts. Several bills put forth in the last Congress as well as President Bush’s campaign proposal fall into this category. 27
The accounts might operate much like an Individual Retirement Account (IRA) or 401(k) plan. Payroll taxes going into the accounts would be invested in assets such as stocks, bonds and mutual funds. The contributions and earnings from investments would accumulate, free of tax, until the worker is ready to retire.
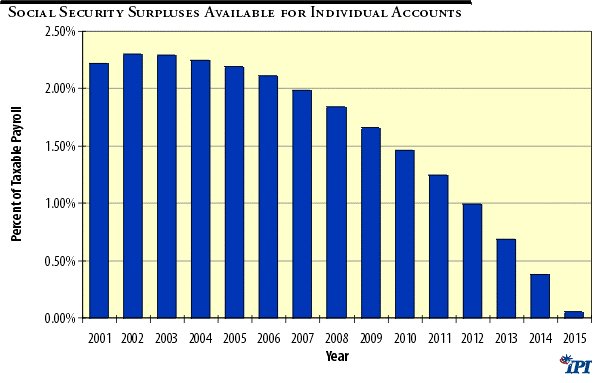
In general, these proposals contemplate using roughly two percentage points of the 12.4 percent OASDI tax rate to fund individual accounts. As Figure 4 shows, the surpluses projected under the Trustee’s intermediate case would be enough to both fund individual accounts with 2 percentage points of the payroll tax and pay benefits for the next ten years. If the economy grows at 2.6 percent instead of 2 percent over the next decade, surpluses would be sufficient to allow workers to deposit 2.5 percent of their taxable wages in individual accounts.
Figure 4
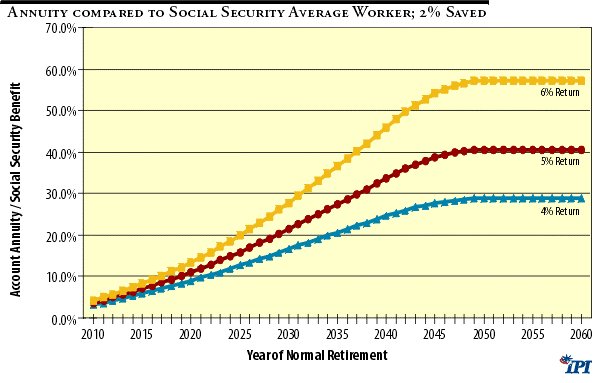
Individual accounts compare very favorably with Social Security retirement benefits, at least for average workers.28 If 2 percentage points of payroll taxes (2 percent of wages) were saved each year starting in 2002, the asset build-up in individual accounts would be substantial. As Figure 5 shows, the annuity value of the average worker’s account would eventually amount to more than a fourth of the Social Security retirement benefit assuming a very conservative return of 4 percent after inflation.29 At a 5 percent return, the annuity value would equal 40 percent of the benefit. Assuming a 6 percent return, still reasonable by historical standards, the account’s annuity value would reach almost 60 percent of the Social Security benefit.
Figure 5
Most proposals would substitute part of the assets accumulated in the individual account for the worker’s Social Security benefit. Depending on the contribution rate and return on assets, doing so could go a long way toward reducing long-run deficits.
More Sweeping Reform
More sweeping reformers advocate a higher contribution rate for individual accounts. Currently, Social Security collects a payroll tax rate of 12.4 percent. In addition to retirement, that also finances a complex network of survivor and disability benefits to workers and dependents. For individual accounts to be viable politically, they should be able provide benefits at least as good as Social Security under most of these circumstances.
Determining whether that is true will require a closer look at lifetime earning patterns of workers and the benefits they, or their family, receive. While that detailed analysis is well beyond the scope of this paper, Table 8 gives a rough idea of the relative size of the various social insurance components of the 12.4 percent tax rate.
Table 8
Components of Social Security Payroll Tax Rate
| Total OASDI Tax Rate |
12.4%
|
|
|
Less Disability Insurance Tax Rate1
|
1.8%
|
|
| Leaves | ||
|
10.6%
|
|
|
Less Survivor2
|
1.8%
|
|
|
Less Dependents of Retired Workers3
|
0.5%
|
|
| Leaves | ||
|
8.3%
|
|
|
Less Progressive Benefit formula4
|
2.0%
|
|
| Leaves | ||
| Retired Worker Benefits adjusted for redistribution |
6.3%
|
|
| 1 Set by law.
2 Survivor benefits account for 17% of OASI benefits. See Table 7. 3 Bnefits to dependents of retired workers account for 4.6% of OASI benefits. See Table 7. 4 Author’s guesstimate based on Table 5. |
||
Under current law, 1.8 percentage points of the tax goes to fund the Disability Insurance program. That leaves a rate of 10.6 percent to fund the Old-Age and Survivors Insurance (OASI) program. Subtracting another 1.8 percentage points for survivor benefits and a half point for the benefits of retired-worker dependents leaves 8.3 percent for retired workers. But, as discussed in the previous section, because of Social Security’s progressive benefit formula, low-wage workers receive a higher return than do high-wage workers. Part of what remains, perhaps 2 percentage points, may be needed to bolster the individual accounts of workers who have low lifetime earnings.
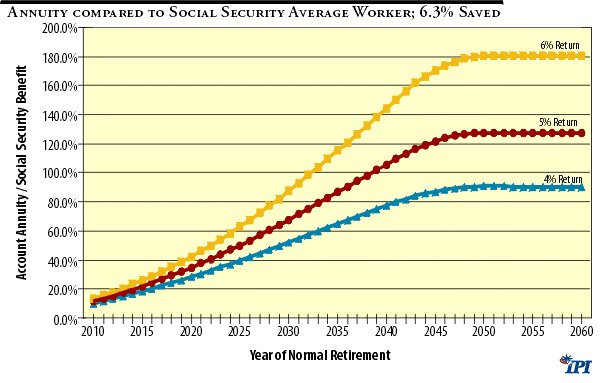
Allowing for the progressive benefit formula and special categories of benefits leaves slightly more than half of the original OASDI payroll tax rate (6.3% of wages) to fund individual retirement accounts. As Figure 6 shows, the annuity value of an account for an average worker 33 years old today and retiring in 2033 would match the Social Security retirement benefit if the account earned an annual, inflation-adjusted return of 6 percent.30 Accounts for younger workers would do even better, with the annuity value eventually stabilizing at 180 percent of the Social Security benefit. Accounts earning 5 percent would take six more years (to 2039) to equal Social Security and would stabilize at 128 percent of the benefit level. At a return of only 4 percent, however, the annuity value would level off at 90 percent of the Social Security benefit.
Figure 6
Recap
Moving away from pay-as-you-go financing and toward personalized prefunding is a Social Security reform long overdue. That means establishing individual accounts owned by workers, funded with payroll taxes and invested in real assets. Proceeds from the accounts could at least partially fund retirement, survivor and disability benefits now provided by Social Security.
That said, numerous questions remain. First, how much of the payroll tax could or should be diverted into the individual accounts? A limiting factor, at least in the short run, is the pay-as-you-go nature of Social Security. Unless some other way is found to pay current and soon-to-be beneficiaries, Social Security surpluses—roughly 2 percent of taxable wages for the next decade—cap contributions to individual accounts.
Even if larger contributions could be made, how closely could private accounts mimic the redistribution of the current Social Security system? The value of the individual accounts will depend on how much each worker earns over his or her lifetime, as well as when. Under a uniform contribution rate, workers who earn higher wages will end up with bigger accounts than those with lower wages. Because of compounding, those employed continuously will build bigger balances than those working intermittently. The question is whether the accounts can provide the same level of benefits to lower-wage or sporadically employed workers and their families as Social Security does. If the answer turns out to be no, the political feasibility of reform will be in serious doubt.
If private accounts are to assume part of Social Security’s role, there must be an ironclad, hold harmless guarantee. Under that guarantee, the proceeds from private accounts earning the average return plus remaining Social Security benefits must leave beneficiaries at least as well off as they would be under current law. The hope is that establishing private accounts will leave most workers better off than before. For those workers that are not, however, some method will have to be developed to make up the difference.
Finally, the success of individual accounts is highly sensitive to the returns they can earn. The higher the return, the more assets will accumulate and the greater the ability of individual accounts to provide benefits as good or better than Social Security. But returns are dependent on how well the economy does, which in turn will depend on tax policy, the topic of the final section.
Social Security Reform and Tax Reform
The primary goal of tax reform is to reduce economic distortions in the U.S. tax system. Simplicity and visibility are ancillary goals of tax reform. Increasing complexity is forcing more and more taxpayers to rely on accountants for help in complying with tax laws. Lack of awareness due to hidden taxes disguises the true cost of government programs.
However, the major gains of reform stem from reducing distortions in the tax system that retard growth and income. These distortions occur because the current system does not treat each dollar of income the same. The last dollar of income earned is taxed more heavily than the first or average dollar. Some types of income are taxed more than once. Whatever their differences, the major approaches to tax reform aim to make the tax system more neutral, that is, to tax each dollar of income once, and only once, and at the same rate.
Tax reform has focused primarily on the federal income tax. That is because most of the complexity and economic distortions of the federal tax system, such as graduated rates and harsher tax treatment of income saved than of income consumed, occur in the individual and corporate income tax. Income taxes are the major source of federal revenue. As Table 9 shows, individual income taxes make up half of federal revenues and corporate income taxes add another 10 percent.
Table 9
Federal Revenues by Source, Selected Years
| |
Actual
|
Projected
|
||||
|
(amounts in billions of dollars)
|
||||||
|
2000
|
%
|
2005
|
%
|
2010
|
%
|
|
| Total receipts |
2,025.2
|
100.0%
|
2,437.8
|
100.0%
|
3,058.4
|
100.0%
|
| Individual income taxes |
1,004.5
|
49.6%
|
1,157.0
|
47.5%
|
1,499.6
|
49.0%
|
| Social insurance and retirement receipts |
652.9
|
32.2%
|
855.8
|
35.1%
|
1,087.9
|
35.6%
|
| Social Security (OASDI) |
480.6
|
23.7%
|
629.0
|
25.8%
|
803.5
|
26.3%
|
| Corporation income taxes |
207.3
|
10.2%
|
244.2
|
10.0%
|
283.5
|
9.3%
|
| Excise taxes |
68.9
|
3.4%
|
80.5
|
3.3%
|
92.8
|
3.0%
|
| Miscellaneous receipts |
42.8
|
2.1%
|
49.3
|
2.0%
|
59.5
|
1.9%
|
| Estate and gift taxes |
29.0
|
1.4%
|
24.9
|
1.0%
|
0.7
|
0.0%
|
| Customs duties |
19.9
|
1.0%
|
26.0
|
1.1%
|
34.5
|
1.1%
|
| Source: Executive Office of the President, Budget of the United States Government, Fiscal Year 2002, Table S-11, March 2001. | ||||||
However, the distorting effects of payroll taxes should not be ignored. Payroll taxes account for a third of federal revenue, ranking second after individual income taxes. Social Security taxes for retirement and disability alone make up almost a fourth. What is more, many workers pay more in payroll taxes than they do in income taxes. In 1996, the employee part of Social Security and Medicare taxes (7.65 percent of wages) exceeded the income taxes paid by 40 percent of workers filing returns. Adding the employer portion (another 7.65 percent) jumps that proportion to over 90 percent.31
In theory, payroll taxes can be neutral. A uniform rate on labor compensation would tax the next dollar of income the same as the first or average dollar. As for simplicity, the bulk of the Internal Revenue Code is devoted to defining and measuring income from capital. In contrast, the definition and measurement of labor income is straightforward, making a payroll tax easy to understand and administer. Visibility is achieved provided that wage statements given to workers delineate all the payroll taxes paid on their behalf.
In practice, payroll taxes have problems. As for neutrality, while the Social Security tax rate is not graduated, the benefits it determines are graduated. From the standpoint of economic incentives, what matters is the net rate, that is, the difference between payroll taxes and expected benefits. Because of the progressive benefit structure, the net payroll tax rate differs with the worker’s wage. Auxiliary benefits vary the net tax rate for workers with the same wage but different family circumstances.
Neutrality and visibility also may suffer from an interaction between payroll and income taxes. Under current law, payroll taxes attributed to the employee are subject to the income tax while those attributed to the employer are not. Suppose a worker earns $30,000 in wages. The $2,295 in Social Security and Medicare payroll taxes (0.765 x $30,000) nominally paid by the employer does not show up on the worker’s W-2 and is not included as part of the worker’s taxable wages. But, because the $2,295 in payroll taxes attributed to the employee comes out of the $30,000 reported as wages, the worker must pay income tax on them as well. While multiple taxation usually affects capital income, some consider this double taxation of wage income. That is why the Kemp Commission report on tax reform recommended full deductibility of payroll taxes.32
Can Social Security Be Reformed without Tax Reform?
The primary goal of Social Security reform is to put the program on sounder financial footing. Under its current pay-as-you-go financing, Social Security faces ever-widening deficits as the payroll taxes collected from workers fail to keep up with benefits promised to retired and disabled workers and their dependents. Pay-as-you-go financing is ultimately unsustainable simply because the ratio of beneficiaries to worker-taxpayers will continue to rise. That is why most reform measures look to establish individual accounts using a portion of the payroll tax. The hope is that these accounts will accumulate sufficient assets to mitigate future deficits.
Even if the accounts accumulate sizable assets, that may not be enough to take care of the deficits. To see why, let us step back from financial flows and look at the real economy in which workers, along with capital, produce the economy’s output. In exchange for their labor, workers receive compensation, which they use to buy goods and services. As now structured, Social Security transfers a portion of the claims workers have on goods and services to beneficiaries. When Social Security runs a deficit, it really means that the economy is not producing enough output to take care of both workers and beneficiaries at the existing level of transfer.
Unless the rate of economic growth increases, only one of the following outcomes is possible. Either workers will have to give up an even greater share of the output they produce relative to what they currently give up—that is, pay higher tax rates. Or, retirees and other beneficiaries will have to forego some of the output they have been promised—that is, have their benefits cut. Both of these results are bad news for the economy. Higher payroll taxes reduce take-home pay and incentives to work. Future benefit reductions also raise tax rates by lowering the return that today’s workers can expect to receive from Social Security. In either case, workers will supply less labor in the face of these higher tax rates, thereby leading to less output. The slower rate of economic growth will put Social Security even further into the red.
Could putting some of the payroll taxes in individual accounts avert this negative result? Some claim unconditionally yes because the money going into individual accounts will increase savings. The problem with this assertion is that unless the return to saving goes up, households will simply rearrange their portfolios to offset the funds going into the individual accounts. The reason: People already save as much as they want given current rates of return. Without an added incentive to save more, they will not.
What is more, even if some of the funds in the accounts do represent new saving, there is another problem. Simple laws of supply and demand hold that added savings will drive down the return, thereby limiting saving growth economy-wide.
On top of these considerations that apply within the confines of a closed economy, there is the question of whether in an open economy new saving that does occur through the private accounts would translate into U.S. investment. The answer would be yes only if the rate of return to plant and equipment sited in the United States also goes up. Otherwise, new saving would flow into investment all around the world. While foreign investments would pay a return to U.S. savers, it would be only a fraction of the benefit to the U.S. economy if the investment had stayed at home.33 What is more, any new saving that translates into U.S. investment will drive down the return to capital, thereby limiting the ability of individual accounts to increase growth.
For individual accounts to work as envisioned, two things must occur. The funds saved must represent new saving and that saving must translate into new U.S. investment. To achieve both conditions the return to saving and the return to U.S. capital investment must increase. The best way to assure those outcomes is to reduce economic distortions caused by the U.S. tax system. In other words, the surest way to Social Security reform is through tax reform.
Conclusions
Social Security is a complex program that touches the lives of virtually every American. On its present course, however, projected widening deficits threaten not only Social Security but also the U.S. economy. The core problem is a pay-as-you-go financing mechanism that becomes more and more unstable as the pool of workers paying taxes continues to shrink relative to those collecting benefits.
Avoiding potentially draconian tax increases or benefit cuts requires fundamental reform be undertaken as soon as possible. Social Security must begin to operate more like a private pension plan in which savings accumulated over a worker’s career finance benefits in retirement. Factors limiting how quickly this transformation can occur and how far it can go include the need to continue paying for current and soon-to-be beneficiaries and to address Social Security’s redistributive aspects. At minimum, near-term Social Security surpluses should allow workers to save two percent of wages in an individual account.
But individual accounts will work only if they represent additions to saving, most of which gets invested in the United States. That is where tax reform comes in. Reducing the bias against capital in the current tax system will raise the return to U.S. saving and make domestic investment more attractive compared to the rest of the world. The combination of new savings generated through Social Security reform and increased growth made possible through tax reform increases the likelihood that the economy will be able to produce sufficient output to satisfy workers and retirees.
Endnotes
1. Supplemental Medical Insurance, or Medicare Part B, is three-fourths financed through general revenues and one-fourth through premiums paid by participating OASI and DI beneficiaries.
2. For a discussion of the taxes on labor compensation, see Gary and Aldona Robbins, How Our Tax System Works, IPI Policy Report No. 154, July 2001.
3. Almost all workers in every kind of employment and self-employment are covered under the program. Exceptions include religious orders under a vow of poverty, foreign affiliates of American employers, and state and local governments in which coverage must be elected by the employer. However, effective July 1991, coverage is mandatory for state and local employees who are not participating in a public employee retirement system. In a few situations, such as ministers or self-employed members of certain religious groups, workers can opt out of coverage.
4. The HI wage base was the same as that for OASDI until the Omnibus Budget Recon<->ciliation Act of 1993 repealed the upper limit on earnings subject to HI taxes effective in 1994.
5. The 2001 Annual Report of the Board of Trustees of the Federal Old-Age and Survivors Insurance and Disability Insurance Trust Funds, Washington, DC, March 19, 2001, Tables IV.A.3, VI.E.8, and VI.E.9, intermediate assumptions.
6. Medicare Part A deficits are projected to rise from 0.43 percent of taxable payroll in 2020 to 7.35 percent in 2075. The 2001 OASDI Trustees’ Report, Table VI.E2, intermediate assumptions.
7. The 2001 OASDI Trustees’ Report, pp. 136–137.
8. Congressional Budget Office, The Economic and Budget Outlook, Fiscal Year 2002, January 2001.
9. For workers with less than 35 years of earnings, zeroes make up the difference.
10. A national average wage index for years after 1950 is used to index the earnings of most workers becoming eligible for benefits in 1959 or later. Over the years, the Social Security Administration (SSA) has used different methods to calculate the average wage. Since 1985, SSA has used wage information from W-2 forms. For more on the method and the historical values of the index see the Social Security Administration, Annual Statistical Supplement, 2000, Table 2.A8.
11. The national average wage was $6,186.24 in 1970 and $24,705.66 in 1995. To adjust for wage growth between 1970 and 1995, the Social Security Administration multiplies the 1970 wage level by the growth in wages between 1970 and 1995 ($24,705.66/$6,186.24 = 3.9936472). See Annual Statistical Supplement, 2000, Table 2.A8.
12. The monthly benefit received by the worker is the PIA adjusted for the cost-of-living and early or delayed retirement.
13. There is a special minimum PIA for those who worked many years but had low earnings. In 1999, there were 131,317 retired workers whose benefits were based on this special minimum. See Annual Statistical Supplement, 2000, Tables 2.A12 and 5.A8.
14. See Annual Statistical Supplement, 2000, Table 6.B5.
15. The PIA was reduced by five-ninths of 1% for every month if the worker retired before the normal retirement age of 65 up to a maximum of 20% at age 62.
16. The AIME was inferred from the benefit formula for1999 using the midpoint PIA for each class. For example, the midpoint of the sixth PIA class, $550.00 to $599.90, is $574.95, and the AIME that produces that value is $881.41. To adjust for the penalty, PIAs used to calculate replacement rates for those with an early retirement reduction were increased by 20 percent.
17. Another often-used replacement rate is the initial benefit divided by the worker’s last year of earnings.
18. The exact amount is $30,469.84. See The 2001 Trustees Report, Table V.C1.
19. The average-wage worker retiring at age 65 would have had an AIME of $2,007.77 and a PIA of $935.38. For those retiring at 62, the AIME would be $2,288.92 and a PIA of $1,025.35.
20. AIMEs of up to $505, the first bend point in1999, received a 90% replacement rate.
21. A PIA of $1,500 translates into an AIME of $3,722.19 at normal retirement age or $4,709.69 for early retirement at 62. On an annual basis that would be $45,266 and $56,516, respectively.
22. The maximum family primary insurance amount (PIA) in 2000 was 150% of the first $679 in the worker’s PIA, plus 272% of the next $301, plus 134% of the next $298 and 175% of anything above $1,278. Whenever the total of the individual monthly benefits payable to all the beneficiaries entitled on one earnings record exceeds the maximum, each dependent’s or survivor’s benefit is proportionately reduced to bring the total within the maximum. Benefits payable to divorced spouses or surviving divorced spouses are not reduced under the family maximum provision. See Annual Statistical Supplement, 2000, Table 2.A13.
23. For disabled workers the number of earning years generally equals the lesser of age 21 and the number of years between 1950 and the year before disability. The number of low-earnings years dropped equals a minimum of two up to a maximum of five.
24. Based on the formula for the maximum family benefit in footnote 22.
25. The GDP deflator is 10.3 times higher than it was in 1937.
26. The ratio of workers to beneficiaries was 41.9 in 1945 compared to 3.4 in 2000. It is projected to drop to 2.1 by 2030 under the Trustees’ intermediate case. The 2001 Trustees’ Report, Table IV.B2.
27. Gregg-Kerrey-Breaux-Grassley on the Senate side and Kolbe-Stenholm in the House would have used two percentage points of the OASDI tax rate to fund mandatory, individual accounts. A bill proposed by Rep. Kasich would have allowed workers the option of redirecting between 1 and 3.5 percent of taxable earnings, with a higher percentage available to lower-income earners, into an individual account. For a description of these bills see United States General Accounting Office, Social Security Reform: Potential Effects on SSA’s Disability Programs and Beneficiaries, Washington, DC, January 2001, p. 13. President Bush’s proposal would have given workers the option of redirecting some of the Social Security payroll taxes they pay into new personal retirement accounts.
28. The “average” worker used in the analysis of potential annuity values of individual accounts is assumed to always earn the average wage for his or her age group, based on the distribution of earnings and number of workers by age. Historically, the average wage rate by age relative to the average wage for all workers is very stable. This relative wage information combined with the Trustees’ intermediate assumptions about wage growth in the future was used to construct earnings histories for the “average” worker.
29. Between 1925 and 2000, the average, annual return after inflation was 9.5% for small cap stocks, 8.2% for large cap stocks and 2% on government bonds. See Ibbotson Associates, Stocks, Bonds, Bills and Inflation Yearbook, 2001.
30. The normal retirement age at that time will be 67.
31. Gary and Aldona Robbins, A Tax Deduction for Payroll Taxes: An Analysis of the Ashcroft Proposal, IPI Policy Report No. 142, June 1997.
32. Unleashing America’s Potential: A Pro-growth, Pro-family Tax System for the 21st Century, The National Commission on Economic Growth and Tax Reform, Washington, DC, January 1996.
33. On average, for every dollar of return to capital invested in the United States, labor and government receive ten. Aldona and Gary Robbins, Manufacturing, Taxes, and the Longest Economic Expansion in U.S. History, Manufacturer’s Alliance, Speaking Out on Critical Issues, February 6, 2001, Table 9.
About the Author
Aldona Robbins, Vice President of Fiscal Associates and Senior Research Fellow of IPI, has analyzed a wide range of issues including how taxes affect the economy, the long-run financial problems facing retirement programs and how government forecasting methods could be improved. Dr. Robbins coauthors the Economic Scorecard , a a publication of the IPI Center for Tax Analysis, that tracks the economy and federal budget. As senior economist in the Office of Economic Policy, U.S. Department of the Treasury from 1979 to 1985, she performed staff work for the Secretary in his capacity as Managing Trustee of the Social Security trust funds. Recent IPI publications include Retiring the Social Security Earnings Test, The Case for Burying the Estate Tax and Adjusting the Consumer Price Index . Dr. Robbins frequently writes on the economy, taxes and Social Security for the financial press. She received a doctorate in Economics from the University of Pittsburgh.