The most politically appealing approach so far has been some form of drug reimportation policy, in which brand name prescription drugs that are made in the United States and sold and shipped to other countries—usually at lower prices than U.S. citizens pay—are then sold and shipped (i.e., reimported) back to U.S. consumers. For example, Republican Senator Charles Grassley of Iowa introduced such legislation in April of 2004. 2 The bill would shut down unregulated importation programs and require the U.S. Food and Drug Administration (FDA) to establish a new system within 90 days.
Since reimportation is simply a way to import price controls from other countries without explicitly adopting them in the United States, the economic consequences of reimportation are roughly the same as directly imposing price controls.
The first section of this study investigates how innovator pharmaceutical and biotechnology firms would likely respond to the legalization of reimportation and/or price controls and quantifies the impact on the rate of innovation and investment in research and development in the United States. Of course, while pharmaceutical and biotechnology firms may be national—or even international—in scope, they reside locally, hiring thousands of employees, funding university research programs and stimulating local economies. Any legislation that harms these industries harms state and local economies where those companies operate.
The last section examines in greater detail the impact of reimportation and price controls on one state—Massachusetts—in which the biotechnology and pharmaceutical industries play a particularly important role.
I. The Impact of Drug Reimportation and Price Controls on the U.S. Economy
Recent Attempts to Impose Reimportation and Price Controls
The United States forbids the reimportation of drugs except when the U.S. Secretary of Health and Human Services (HHS) is willing to certify the safety and significant cost savings of the drug(s) to be reimported. Neither the current secretary, Tommy Thompson, nor the secretary during the Clinton administration, Donna Shalala, provided that certification. Nevertheless, consumer groups (and their elected representatives) wishing to reduce drug prices are actively attempting to bypass this obstacle.
As a practical and political matter, the FDA allows U.S. citizens traveling in other countries (e.g., Canada) to bring back a small amount of prescription drugs (usually considered 90 days worth) for personal use. That does not make their actions legal; the law is just not strictly enforced.
State and Local Efforts to Reimport Drugs
Several states are considering ways to permit or facilitate access to reimported drugs. Moreover, some cities have already implemented programs that allow city employees and retirees to import drugs from Canada. For example, the city of Springfield, Massachusetts, led by its mayor, is already importing drugs from Canada for city employees. The mayor has brushed aside FDA warnings that he is putting citizens at risk, even after the FDA checked some of the drugs from the Canadian source and found that some of the insulin had been compromised.
The rush to reimport is occurring despite the fact that the FDA has expressly and repeatedly warned both states and cities that such actions are illegal and unsafe. In response:
- The governor and attorney general of Vermont have filed suit against the FDA for rejecting its plan to allow Vermont employees to reimport drugs from Canada. Iowa is considering joining that suit.
- The governor of Illinois is moving forward with a plan to allow citizens of the state to reimport drugs from Canada, the United Kingdom and other countries—abandoning any pretext at restricting the drug sources to Canada.
In addition, the mayor of Boston has indicated that he would like to adopt a similar policy. Massachusetts Senator Edward M. Kennedy is a sponsor of a bill that would allow imports of prescription drugs from Canada, and Democratic presidential candidate John Kerry has called for legalizing reimportation. In fact, reimportation schemes have gained such momentum that President Bush now agrees that, “If it’s safe, then it makes sense.” 3
The Effort to Impose Price Controls
Calls for imposing price controls on prescription drugs enjoy less attention, in part because economists have repeatedly shown that price controls, regardless of the product or service, don’t work. They always lead to access and/or quality problems.
Rather than be seen as supporting price controls, proponents of reimportation would rather import the price controls of other countries. That allows them to say publicly that they oppose price controls while bringing them in through the back door.
While there are no explicit drug price controls in the United States, state governments buy drugs under the Medicaid Drug Rebate Program, which imposes de facto controls on the prices paid for pharmaceuticals. However, some states, including West Virginia and Oklahoma, have considered bills that would directly impose price controls.
The Response to Drug Reimportation and Price Controls
The introduction of drug reimportation and/or price controls in the United States would affect incentives facing consumers, drug makers and governments in both the United States and foreign countries. The resulting decrease in drug prices would have direct consequences for the drug-consumption decisions of consumers, and for production and research and development decisions made by pharmaceutical and biotech firms. Questions about the desirability of such policies must therefore be addressed in recognition of their likely effects on economic behavior and the economy. The benefits to one group might be offset—or more than offset—by costs to another. And there would be negative—and perhaps unintended—consequences for pharmaceutical innovation and economic activity.
Reimportation and price controls derive their appeal from the promise of lower out-of-pocket expenses for drug buyers, whether individual consumers, firms or municipal governments pay for the health expenses. A recent report in the Boston Globe describing the drug reimportation experiment in Springfield, Massachusetts, estimates that the city has saved $3 million on drug expenses for its current and retired employees. For its typical retired employee (retirees are older and typically need more medications), Springfield reportedly saved $997.88 per year, while the retiree saved $280.00 during the same period. 4
Despite the apparent savings, there are concerns about the quality and safety of reimported drugs. While many patients assume that reimported drugs are of U.S. origin, manufactured under the FDA’s safety guidelines, a recent report by Giuliani Partners, LLC indicates that in many cases drugs purchased from Canada are manufactured in Pakistan, China, Iran, Singapore or elsewhere. The report points out that “there is significant evidence that patients have received drugs through the Internet that are past their expiration date, are sub-potent (or, in some cases, more potent than indicated), are contaminated or clearly counterfeited, are not properly stored or shipped.” 5
Had drug reimportation continued on a small scale, with small numbers of U.S. citizens occasionally traveling to Canada to buy their prescriptions, there would have been little impact on the drug manufacturers or the economy. However, that is no longer the case. The Springfield model could spread to other cities and even states, should the FDA continue to decline to intervene legally. If reimportation is widely adopted in the United States, it will profoundly affect the behavior of consumers and U.S. drug makers, as well as the health care systems in countries from which drugs are reimported.
Possible Response: Countries Cut Supplies to the United States
A possible response to reimportation is action by foreign governments, themselves eager to provide an abundant supply of price-controlled drugs to their own populations. One can hardly expect Canadian health care administrators to be complacent about growing shortages of drugs in Canada due to reimportation by Americans. While the effect on the supply of drugs in Canada may not be noticeable when only a few cities reimport drugs, U.S. prescription drug consumption (53 percent of the world market) is so large that it would have a negative effect on the supply of drugs in Canada (or, for that matter, in any other country). Indeed, some Canadian officials are already looking for ways to curb exports to the United States. Corroborating these points, a recent report by the U.S. Congressional Budget Office (CBO) published in November 2003 estimated that adoption of a nationwide reimportation program would reduce total prescription drug expenditures by about 1 percent, or $40 billion, from 2004 through 2013. 6 The saving is small as a result of the required counterfeit-resistant packaging of both imported and non-imported drugs. The estimated impact on total expenditures was calculated by taking into account the potential actions of drug manufacturers to regain profits by restricting supply. 7
Possible Response: The Birth of a Domestic Black Market
Price controls may also encourage the development of gray or black markets in drugs, especially if certain states successfully impose price controls while others do not. To the extent that prices vary across regions, intermediaries will have an incentive to engage in spatial arbitrage. For example, if the controlled price of the anti-cholesterol drug Lipitor is lower in Arkansas than in Massachusetts (which may well be the case if regulated prices in different states are set according to average state income levels), intermediaries would purchase Lipitor in Arkansas and resell it at a higher price in Massachusetts. These arbitrage activities may result in shortages of (and queues for) drugs in Arkansas and a higher effective price paid for Lipitor on the gray/black market, defeating the purpose of price controls.
Attempts to control or prohibit such arbitrage may themselves be costly to society and of limited success. Existence of illegal markets for price-controlled goods in many countries and in many regulatory settings testifies to the difficulty of the price-control approach.
Possible Response: Supplies Follow the Prices
In addition to the above-mentioned impact of price controls, pharmaceutical and biotech firms may decide to respond to the lower relative price of drugs in the United States by selling less in the United States and more in other developed countries with no price controls (such as the United Kingdom and Germany), and to search for new markets where price controls are not present. While the magnitude of this response will depend on the severity of U.S. price controls, such policies would clearly encourage companies to offer their products elsewhere.
Possible Response: Reduced R&D Spending
Drug reimportation and price controls would also affect investment in the research and development of new drugs. This problem is addressed in greater detail in the next section. Here it is worth mentioning that a 2003 study points out that parallel trade leads to the launch delay of major new drugs. 8
A firm that is about to launch a new drug would do so promptly everywhere, if it could charge different prices in different national markets (taking into account levels of income, regulations and willingness to pay on the part of consumers). However, if parallel trade exists, allowing countries with higher incomes to import drugs from countries with lower incomes, and therefore with lower drug prices, this option is much less attractive.
For example, under a system of parallel trade, providing one country, say, Portugal, with a lower price could have a twofold effect:
- It may undermine its future price in a not-yet-launched but richer country, say, France, because French regulators may take Portugal’s price as a reference point or benchmark point for a drug’s French price.
- Through parallel trade, it may undercut revenues in other countries where a firm charges a higher price.
The authors of one article pointed out that a firm’s response in this case is to “accept delay, and in the limit, forego launch entirely, rather than agree to relatively low price in one country, particularly in a country that is small and prone to parallel exports to other, potentially higher-price markets.” 9
The authors found that countries with lower expected prices or smaller expected market size within the European Union experience longer delays in new drug access. While the European Union permits parallel trade in drugs between member countries, the regulatory policies of the United States and Canada may be different. The response of Canada (having a relatively small market size) to parallel trade with the United States could be to prohibit such trade altogether or face delay in access to new and effective drugs.
II. The Impact of Reimportation and Price Controls on Drug Innovation and R&D Expenditures
Drug Development and the Approval Process
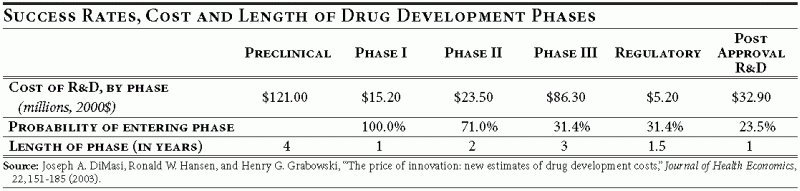
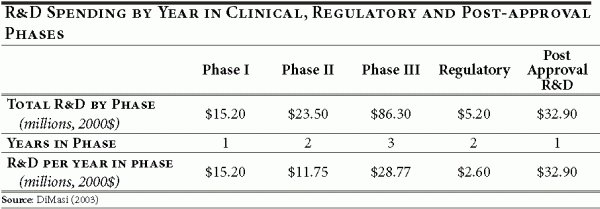
Pharmaceutical product development is a lengthy process, often taking 10 to 15 years to develop a single drug. Ultimately it is a process of generating economically valuable knowledge about a specific pharmaceutical compound. At the point of discovery, this knowledge includes information about compound structure and its basic effect on biological systems such as cells or target viruses. As preclinical development continues, scientists learn about the compound’s effect on animals in trials that last on average four years.
If animal studies succeed, then human safety trials—the “Phase I” trials—come next. To start human clinical trials, a sponsor of a drug must file an Individual New Drug application (IND) with the U.S. Food and Drug Administration (FDA). At this point the knowledge generated by animal studies is translated into optimal dosage regiments for the 20 to 80 healthy volunteers. The resulting data are accumulated and used to design drug efficacy trials for Phase II and III that last on average two and three years, respectively. Company scientists have to decide which patient group is likely to have the best response to treatment and set up trials to compare with a placebo group.
Phase II trials test efficacy on a smaller group of patients. Results of this stage are needed to design Phase III trials, which are usually placebo-controlled and include a much larger patient population. If a drug passes Phase III, the company can apply for regulatory review by filing a New Drug Application (NDA) with the FDA, the last regulatory review stage, lasting on average 1.5 years—and it still may not be approved.
Table 1
Any bias introduced in the design of the earlier clinical trials may affect the outcome of the later stages and therefore jeopardize the entire project. Conversely, a clean design and understanding of each set of trials could make regulatory approval a relatively painless undertaking.
The Cost of Drug Development
The cost of drug development has risen tremendously from slightly over $100 million per successful drug in the 1980s to about $800 million in 2003. 10 The high cost of drug development is in part due to the high failure rate. Although only one in five projects makes it to consumers, all projects, both successes and failures, require a constant flow of cash, adding to the final cost of successful projects. Funds spent on the development of drugs that eventually fail safety or efficacy tests or prove to be potentially money losing are legitimate costs that successful drugs must recoup. Not being able to recoup all expenses (including those of eventual failures) would deprive companies of necessary funds to finance the search for new therapies.
Modeling Methodology
We use a “real options” theory framework to simulate the effects of price control and reimportation policies on the valuation of R&D projects. 11 Using this framework, we determine the value and development desirability of a project in each stage of development. For each stage, a firm compares the expected cost of a project’s completion to the expected value of continuing a project. If the former exceeds the latter, the project is abandoned. If not, the project continues. The real options model takes into account the level of and uncertainty in the cost to completion of a project, growth rate of and uncertainty in cash flows resulting from a project, as well as the possibility of failure because the drug doesn’t meet safety or efficacy standards.
Since the behavior of cash flows and cost to completion is uncertain, the randomness is modeled using a stochastic process model and calibrated to reflect actual characteristics of cash flows and cost levels and uncertainty parameters in pharmaceutical product development. 12 A typical development project could be abandoned for technical reasons (i.e., because it fails a test for safety or efficacy), or for economic reasons (i.e., it is deemed to lack future profitability). The actual continuation/abandonment decision depends on the comparison of cost to completion with the value of continuing the project. Since cash flows and development costs are influenced by random factors, any single scenario for a project with given characteristics may or may not result in abandonment, depending on realization of many random technical and economic factors. To obtain the probability of abandonment of such a project due to economic reasons, the model is simulated 10,000 times and the average proportion of times the project is abandoned is taken as an estimate of this probability.
The effect of price control and reimportation policies is modeled through the cash flow growth or drift parameter. Imposing price controls or lowering prescription drug price inflation indirectly through reimportation or parallel trade translates into a lower growth rate of cash flows that a firm is expected to receive from sales of its drugs. A typical firm subject to these policies is likely to find that more of its projects are economically infeasible, as expected cost to completion exceeds expected revenue. Consequently, one would expect that more projects would be abandoned for economic reasons under such policies.
The evaluation of a price control (or reimportation) policy is based on a computational experiment. The purpose of the experiment is to determine how innovation success rates and R&D investment will change if a policy limiting prescription drug inflation (and hence a firm’s cash flow growth) is introduced in 2005. The actual average prescription drug inflation rate between 1983 and 2004 was 6 percent a year, while general consumer price inflation averaged 3.13 percent annually for the same period. Suppose the U.S. government forces the prescription drug inflation rate to be reduced to 3.13 percent beyond 2004 via price controls or reimportation. How might innovation and R&D spending be affected (relative to the status quo)? The next subsection addresses precisely this question.
Results
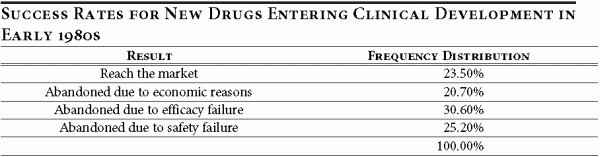
Drug development projects could be abandoned for technical reasons (such as a failure of safety or efficacy tests for a drug) or for economic reasons (when the drug is no longer perceived to earn enough profits in the future). Table 2 illustrates the abandonment rate of projects in the 1980s. 13
Table 2
The introduction of price controls or of a reimportation policy is unlikely to affect the technical aspects of a project, since efficacy and safety are innate properties of a drug and its interaction with human physiology. What the policy change would do is to change the financial prospects for the drug. Therefore, the results presented focus on the economic reasons for abandoning drug development projects.
Suppose that a reimportation or price control policy had the effect of limiting annual prescription drug inflation to 3.13 percent, beginning January 1, 2005. The simulation tracks the effect of such a policy on the innovation rate and the number of drugs abandoned for economic reasons after the policy is enacted. We assume that development through clinical trials lasts, on average, eight years. Thus, drugs entering clinical trials as far back as 1998 will be affected by the new policy (for drugs entering the pipeline before 2005, the effect of the policy will be greater the more recently the drug was introduced). We assume that 130 new drugs enter clinical development each year, which is consistent with the recent statistics on new drug introductions. 14
The results of the real options investment model indicate that under such a policy the abandonment rate for economic reasons for all cohorts entering in 2005 or after is equal to 37.5 percent. This considerably exceeds the actual abandonment rate (for economic reasons) reported in the baseline simulation (20.7 percent, see Table 2 above), suggesting that the new policy could have severe consequences for drug innovation rates. According to the baseline assumptions in our model (an approval rating of 23.5 percent), a cohort reaching clinical trials, consisting on average of 130 drugs, could be expected to yield 31 new drugs. 15 Under a price control policy, this same cohort can be expected to yield only nine new drugs, a decrease of over 70 percent. 16
As a result of the price controls, an estimated 48.75 drugs out of a cohort of 130 drugs entering clinical trials in 2005 would be abandoned for economic reasons by 2012. Under the baseline conditions, only 26.91 drugs would be abandoned for economic reasons. The same is true for all cohorts entering drug development after 2005.
What about drugs entering development prior to 2005? What is the effect of such a policy on the number of drugs abandoned after 2004? Consider a cohort of drugs entering development on January 1, 2004 — a year before the new policy takes effect. By January 1, 2005, some of the R&D funds would already have been spent, so the cost to completion of a project would be lower one year later (on January 1, 2005). This means that by 2005 it is less costly to complete a project started in 2004, and therefore the effect of the policy would be less severe. In fact, the (post-2004) eventual abandonment rate for cohorts entering development between 1998 and 2004 gradually declines as we approach the 1998 cohort as most of the costs have been sunk (by 2005) and the remaining cost-to-completion is small relative to expected future revenues. This is illustrated in Table 3.
Table 3
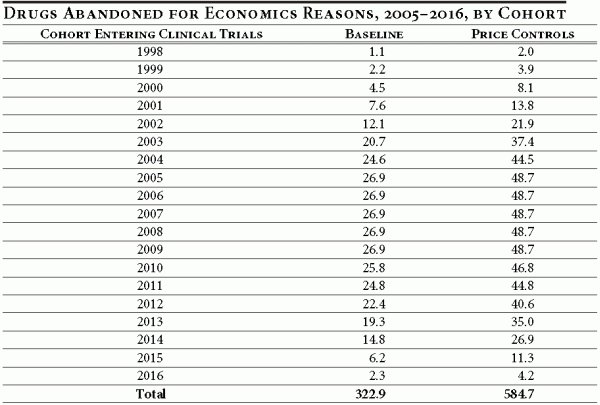
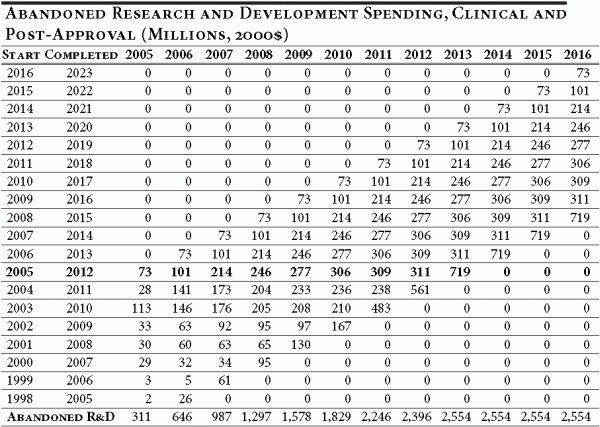
Columns two and three indicate the number of drugs abandoned for economic reasons, per cohort, under the baseline conditions and with price controls for the period 2005–2016. For cohorts entering clinical trials from 1998 through 2016 under the baseline conditions, 323 drugs would have been abandoned. Under the new price control policy, approximately 585 drugs would be abandoned during this same period. Thus, during the first 12 years of the price control policy, an additional 262 drugs would be abandoned (for economic reasons). It should be noted that for the past 12 years, up to and including 2003, only 370 new drugs were approved by the FDA.
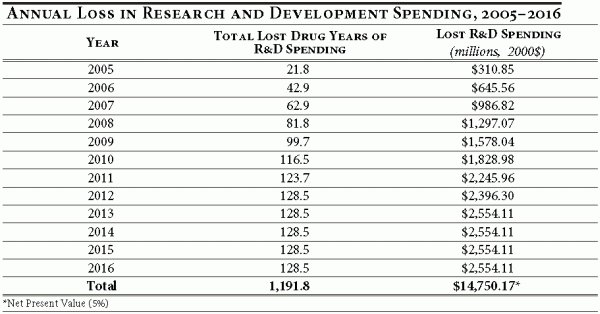
To evaluate the full effect of the proposed policy, we need to compare the difference between the number of drugs in the pipeline in a given year under the baseline assumption versus the number of drugs in the pipeline under the price control policy. 17 This is accomplished by calculating the total number of lost drug years of R&D spending. Under the baseline assumption, a drug that successfully completes clinical trials represents eight years of R&D expenditures. A drug abandoned for economic reasons due to the price control policy in the fourth year of clinical trials represents a loss of four drug years of R&D spending. Table 4 illustrates this difference by year and the associated difference in R&D spending.
The key result of this exercise is that lost R&D spending, while moderate in the first year of a price control or reimportation policy, becomes substantial very quickly, as the cumulative effect of abandoned drug years grows with each new cohort entering development.
The results illustrate that in 2005 the U.S.-wide losses in R&D spending amount to $310.9 million (in 2000 dollars), but grow quickly as new cohorts of drugs enter development and reach $2.6 billion by 2013. In the 12 years following the implementation of a price control policy, R&D spending by pharmaceutical and biotechnology firms would fall by $14.8 billion, in net present value terms.
Table 4
The conclusion of this exercise demonstrates that price control policies, while yielding lower out-pocket-costs for consumers in the short run, are likely to have noticeable adverse consequences on innovation and R&D investment in the pharmaceutical and biotechnology industries in the long run.
Short and Long-Run Consequences of Reimportation and Price Control Policies for Consumers and Firms
The discoveries of innovator biotechnology and pharmaceutical firms are protected by patents. Patent protection is a statutory monopoly granted by the state to encourage innovation. Without it generic drug manufacturers that invested nothing in discovery would offer the drug to consumers at deeply discounted prices. With the patent protection, generics must wait until the patent expires—about 20 years from initial creation, but only about eight to 10 years of actual time on the market—before copying the drug and offering it at its marginal cost.
Allowing generics to copy a brand name drug would be attractive to many consumers—as well as many politicians—in the short run, because it could force brand name companies to lower the price of existing (i.e. already discovered and manufactured) drugs. In this setting, all else equal, a lower price would likely increase the demand for the drug or therapy. 18 Because drug manufacturing costs are small relative to drug discovery and development costs, the equilibrium of supply and demand for an existing drug is likely to be at a lower price and greater quantity than under a monopolistic setting created by patent protection.
Reimportation and price controls would have the same effect as eliminating patent protection because brand name drug companies would be forced to sell at prices equal (or close) to the manufacturing cost of a drug. Thus, reimportation, price controls and weakened patent protection would appear to “solve” the perceived problem of high drug prices by weakening or counteracting the statutory monopoly power of drug companies, in effect transferring profits from firms to consumers. However, as discovered in the previous section, these policies would have dramatic adverse consequences in the long run. Lower prices would decrease profits available for R&D investment and drastically lower the innovation rate. Figure 1 below provides a simplified economic explanation of this point.
Figure 1
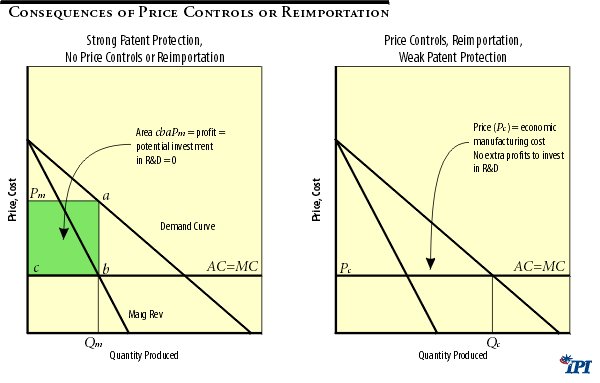
Figure 1 illustrates the effect of lowering drug prices in the short run. With no price controls or reimportation policies, a typical firm will enjoy a monopoly position and will be able to charge a profit-maximizing price () , which is above the drug’s marginal (MC) and average (AC) manufacturing cost. The resulting quantity () is sold at this price.
The drug maker will enjoy a total profit shown by the area (which is simply a per-unit profit times the quantity sold ()). Such profit is not a pure gain by a firm since the diagram does not show the amount of funds invested in research and development for drugs that made it to market, as well as for drugs that failed to make it to market. Over the long run the potential amount of R&D investment into the future cannot exceed the profit earned by a firm. Although a firm could borrow or raise funds by issuing shares, the highly uncertain nature of investment makes external financing exceptionally risky for investors and lenders. Ultimately, the investment capacity of pharmaceutical and biotechnology firms depends on their internal sources of financing—that is on their profits.
Implementing price controls or allowing reimportation would limit the price that could be charged by a firm to a price that is below the monopoly price (). While the outcome of a policy depends on its specifics, the price under new regulations cannot be lower than the manufacturing cost of a drug. At any price below manufacturing cost there will be no producers who are willing to manufacture a drug. The price charged for a drug could be lowered, however, to the manufacturing cost, that is: . 19 The quantity of a drug sold () now exceeds the quantity sold without price controls (). Although this result may suggest that the market for a drug has expanded, in reality we do not see any sustained growth in demand, but only a movement along the demand curve in response to a lower price. 20
This expansion has a clear detrimental effect on a drug maker’s profits, but is beneficial to consumers in the short run. Any price below would result in lower profit (as is the profit maximizing price charged by a firm). Moreover, when the controlled price () equals the average per unit cost of manufacturing a drug () there is no profit to be invested into R&D for future and more effective therapies and drugs. The short-run consumer gain from a lower price would come at substantial long-run sacrifices in availability and quality of new therapies. 21 The adverse long-run effects on consumers are twofold:
- As established in the previous section, all consumers would have fewer new drugs and therapies.
- Indirectly those consumers who live in states housing a substantial number of pharmaceutical and biotechnology firms will also be affected by lower investment in pharmaceutical R&D.
Massachusetts is one such state and its vulnerability to such price control policies is the focus of Section�3.
III. The Impact of Drug Reimportation and Price Controls on the Massachusetts Economy
Research and Development in the Massachusetts Economy
For the past two decades, Massachusetts has been a leader in the global biotechnology industry. Home to pioneering biotech firms in the 1970s, the region has effectively utilized its outstanding universities and academic medical centers to fuel its rapid growth. This strong research base, along with a well-educated workforce and strong legal and financial institutions, has fostered an environment in which Massachusetts has become one of the world’s largest biotech clusters.
The tech-friendly environment has lured some of the industry’s largest companies and attracted significant investment dollars to the state. Today, Massachusetts is home to 280 biotech companies (including three of the nation’s 10 largest) and employs over 30,000 people. It accounts for approximately 18 percent of the state The tech-friendly environment has lured some of the industry’s largest companies and attracted significant investment dollars to the state. Today, Massachusetts is home to 280 biotech companies (including three of the nation’s 10 largest) and employs over 30,000 people. It accounts for approximately 18 percent of the state’s venture-capital investment, 27 percent of its R&D spending and one sixth of its public companies. 22
The rapid growth of the past two decades has brought additional benefits to the state beyond the biotech industry. A study released in May 2000 estimated that for every direct job created in the biotech industry, an additional two jobs are created throughout the rest of the economy. 23 Based on this estimate, the total employment attributable to the Massachusetts biotech industry is on the order of 90,000 jobs.
Impact of Pharmaceutical R&D Spending under Price Controls or Reimportation
The United States is the world leader in pharmaceutical research and development, investing an estimated $27 billion on domestic R&D in 2003. 24 As one of the industry’s largest research centers, Massachusetts sees a relatively large percentage of this spending each year. In 2001, R&D spending by biotech firms in Massachusetts totaled approximately $2.3 billion.
As shown in Section 2, price control policies, while yielding short-run benefits to consumers, are likely to have substantial adverse consequences on R&D spending. In 2005 alone, this represents a potential loss of over $310 million in domestic R&D spending. In Massachusetts, the loss would be $31.4 million. 25
Economic Impact on the Massachusetts Economy
Although there are varied methods of measuring economic impacts, the idea is straightforward. Initial spending in an economy has a “ripple” effect whose influence flows through to other sectors and households in the region. In essence, the initial spending in one sector brings about further spending in other sectors. This process creates new income and employment as it reverberates through the business community. Depending on the size of the initial impact, these ancillary effects can be quite large. For example, Boeing’s contribution to the Greater Seattle economy extends far beyond its initial outlay in wages and purchases.
In other words, each expenditure has what economists call a “multiplier” effect that represents the recycling of money and income in an economy. By determining the multiplier for each category of expenditures, it is possible to simulate the initial spending and trace its influence through an economy. By measuring the change in economic indicators (employment, for instance) we can calculate the ultimate economic impact.
The economic contribution of R&D spending in Massachusetts consists of three types of impacts: direct, indirect and induced.
- The direct impact represents the economic impact directly attributable to the biotech firms: local purchases and employee compensation. For instance, in the pharmaceutical or biotech industries this may take the form of spending on legal services to secure patents. This spending creates income and employment directly for the industry’s vendors (legal services in this case).
- The indirect impact represents the spending done by other businesses supplying the goods and services demanded by the industry. For instance, the spending done by a local law firm as a result of its hiring by a biotech firm creates employment and income for the law firm’s vendors.
- Finally, the induced impact refers to the income and employment created as a result of the spending done by the employees of the biotech industry, its intermediate suppliers and its vendors. Restaurants, real estate agents, gasoline stations, etc. all benefit from the local spending done by employees.
Using the IMPLAN model (See Appendix) to describe commodity flows through the Massachusetts economy, we estimate the annual impact on the state economy as a result of the abandoned R&D spending. Table 5 below summarizes the cumulative impact through the first six years of a price control policy.
Table 5
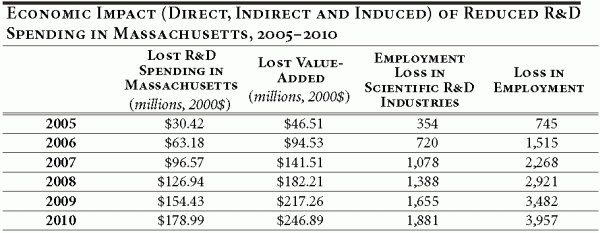
We measure the economic impact using value-added as a measure of local economic activity; it represents the economic activity that ultimately sticks in the Massachusetts economy. Included in value-added are employees’ wages, proprietors’ income, indirect business taxes and corporate profit.
The loss of R&D investment in Massachusetts has overarching effects on the state’s economy. The cumulative loss in employment for the period 2005–2010 is 3,957 jobs, many of these (1,881) in high-paying research positions. The lost R&D spending further results in a cumulative loss of $247 million in regional value-added.
Endnotes
- Canadian drugs are generally 30% to 80% cheaper than their American counterparts.
- Crain Communications, Inc. “States, municipalities defy federal ban on Canadian drugs,” May 3, 2004, page T18.
- Associated Press, “Bush: Importing drugs makes sense, but only if it’s safe,” August 18, 2004.
- Boston Globe “Drug imports save Springfield $3m,” June 26, 2004, page A1.
- Rudolph Giuliani, Interim Report to the U.S. Health and Human Services Taskforce on Drug Importation , May 11, 2004.
- U.S. Congress, Congressional Budget Office, “Would Prescription Drug Importation Reduce U.S. Drug Spending?” Economic and Budget Issue Brief, April 2004. Referenced at http://www.cbo.gov [Accessed July 15, 2004].
- However, the CBO report neither discusses its calculation methodology in great detail, nor does it explain why the anti-counterfeit technology would be applied to both imported and non-imported drugs under this act.
- Parallel trade is cross-border trade in a drug manufactured by the same firm. Typical motivation for such trade is a drug’s price discrepancy between two or more countries—beneficiaries are consumers in higher price countries, and arbitrageurs that earn the difference between lower and higher prices. See for instance, Patricia M. Danzon, Y Richard Wang, and Liang Leon Wang, “The Impact of Price Regulation on the Launch Delay of New Drugs—Evidence from Twenty-Five Major Markets in the 1990s,” National Bureau of Economic Research, Working Paper No. 9874, (July 2003).
- Danzon, Wang and Wang (2003).
- Figures represent the capitalized cost per successful drug as reported in Henry Grabowski, John Vernon and Joseph A. DiMasi, “Returns on Research and Development for 1990s New Drug Introductions,” Pharmacoeconomics: 20, Suppl. 3:11-29 (2002).
- Unlike ordinary net present value approach, real options approach reevaluates investment value each investment period, and opens a possibility of a project’s expansion, contraction or even abandonment. The implementation of the valuation algorithm follows that developed by Eduardo Schwartz. See Eduardo S. Swartz, “Patents and R&D as Real Options,” National Bureau of Economic Research, Working Paper No. 10114, (2003).
- Formulated by Schwartz (2003); see Schwartz (2003), p. 42.
- Calculations are made on the basis of development outcomes statistics for new drugs that entered clinical development in 1980–84. See Joseph A DiMasi, “Success Rates for New Drugs Entering Clinical Testing in the United States,” Clinical Pharmacology & Therapeutics, 58(1), (1995).
- U.S. Congress, Office of Technology Assessment, “Pharmaceutical R&D: Costs, Risks and Rewards,” OTA-H-522 , Washington, D.C.: U.S. Government Printing Office, (February 1993).
- The actual annual average for the period 1994–2003 is 32 new drugs a year. PhRMA (Pharmaceutical Research and Manufacturers of America). PhRMA Industry Profile.2004. Available at: http://www.phrma.org/publications/publications//2004-03-31.937.pdf. Accessed August 17, 2004.
- Under the baseline assumption, of the 130 drugs in a cohort entering clinical trials, 39.78 (30.6%) are abandoned for efficacy reasons, 32.76 (25.2%) are abandoned for safety issues, and 26.91 (20.7%) are abandoned for economic reasons. This yields 30.55 new drugs per cohort. Under price controls policies, of the 130 drugs in a cohort entering clinical trials, 39.78 (30.6%) are abandoned for efficacy reasons, 32.76 (25.2%) are abandoned for safety issues, and 48.75 (37.5%) are abandoned for economic reasons. This yields 8.71 new drugs per cohort.
- This value represents the cumulative effect of drugs abandoned in varying stages of development. For instance, a drug that was approved under the baseline case but abandoned after two years under price controls has lost seven drugs years worth of R&D spending. We cumulate the R&D spending to account for this difference.
- Findings by Caves, Whinston and Hurwitz (1991), Grabowski and Vernon (1992) are consistent with downward sloping demand curve for drugs and therapies.
- The manufacturing cost also includes the “normal” profit of manufacturer—the amount of profits needed to keep manufacturing entrepreneur from investing his talents elsewhere.
- Demand curve defines a relationship between quantity demanded and price of a good, all else equal. Change in price (whatever its source) would only change the quantity along the demand curve. The demand curve can shift only if there is a change in factors other than price. Hence, price controls cannot shift demand curve unless price controls change some other real variables affecting demand (i.e. income, tastes etc) which is unlikely.
- Recent Congressional Budget Office report reviewed in section 1 indicates that even the consumer savings from lower drug prices are likely to be small.
- Massachusetts Biotechnology Council and The Boston Consulting Group, MassBiotech2010: Achieving Global Leadership in the Life-Sciences Economy, 2002.
- Ernst & Young, “Economic Contributions of the Biotech Industry to the U.S. Economy,” May 2000.
- Pharmaceutical Research and Manufactures of America (PhRMA), Pharmaceutical Industry Profile 2004 (Washington, DC: PhRMA, 2004).
- Massachusetts R&D spending accounts for approximately 10% of the nation’s total. In 2001, Massachusetts biotech companies spent approximately $2.295 billion on R&D while the total domestic spending was approximately $23.502 billion.
Appendix I
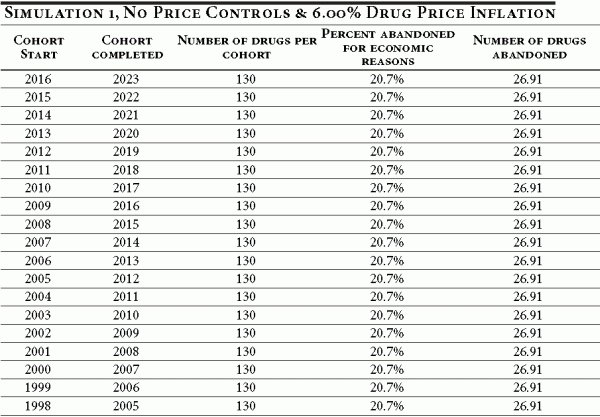
Table A1 illustrates the baseline case of no price controls and an average prescription drug inflation rate of 6 percent. Under these conditions, a cohort entering clinical trials in 2007 would be expected to complete regulatory review by 2014. Of the original 130 drugs in the cohort, we would expect 27 to be ultimately abandoned for economic reasons.
Table A1
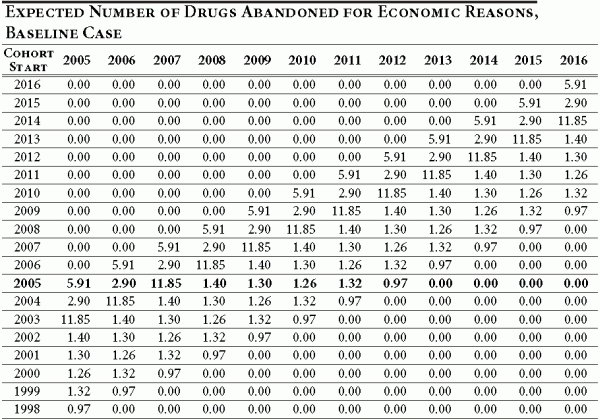
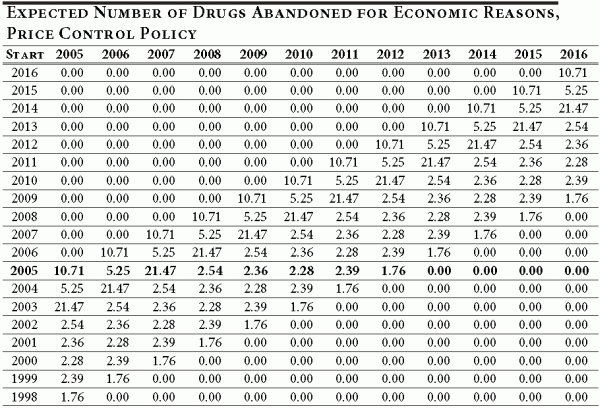
We assume that the average length of clinical and post approval R&D for each cohort is nine years and apportion the drug abandonment according to the timeline in Table 1 of the text. In the baseline case, in which 20.7 percent of all drugs in a given cohort are ultimately abandoned for economic reasons, we use estimates derived in DiMasi (DiMassi, 2003) to develop an annual abandonment schedule. This is illustrated in Table A2 below. As mentioned previously, cohorts entering clinical trials prior to 2005 will have abandoned some number of drugs in the past.
Table A2
The simulation results of the real options investment model indicate that under a price control policy the economic abandonment rate over the clinical life of a drug development project (eight years) equals 37.5 percent. The results say that of the 130 drugs introduced in a year following the implementation of the policy, 48.75 drugs (or 37.5 percent of 130) would be abandoned for economic reasons (see bolded row, Table A3 below). The same abandonment distribution as the baseline is assumed under the new price policy.
Table A3
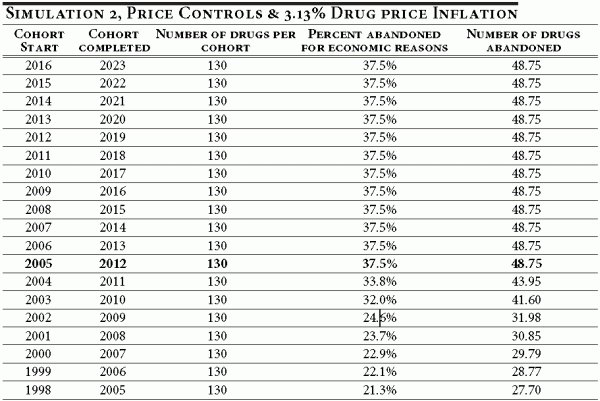
The abandonment rates for cohorts entering clinical development prior to 2005 are illustrated in Table A3. As explained previously, the abandonment rate declines as the time to completion falls. For instance, a cohort entering clinical development in 1998 would be in its last year of development when price controls are imposed. As Table A4 illustrates, the 1998 cohort would abandon 1.76 drugs under the new price control policy in 2005 (in the baseline case, the cohort would have abandoned 0.97 drugs in 2005; see Table A2).
Table A4
Now we are ready to consider the difference between the number drugs abandoned under the proposed policy (3.13 percent) and the status quo (6 percent). Table A5 illustrates this difference for each cohort entering drug development between 1998 and 2016, and provides a year-by-year breakdown. To obtain Table A5, we simply calculate the difference between Table A2 and Table A4.
Table A5
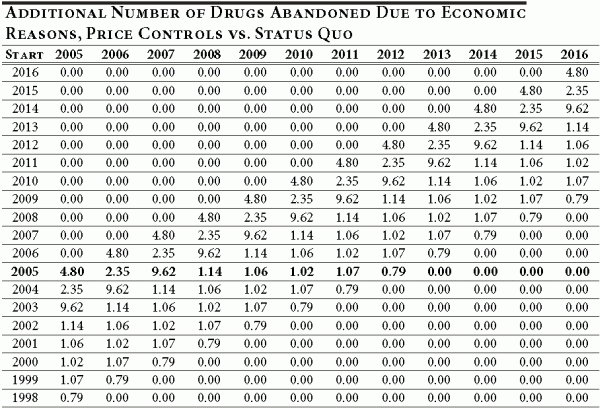
Each entry in Table A5 shows the number of additional drugs abandoned for economic reasons over and above the number that would be abandoned under the status quo. For example, the number of additional drugs abandoned in 2009 for a cohort of drugs entering development in 2007 is 9.62. Therefore, Table A5 provides a cohort-by-cohort and year-by-year difference in the number of drugs abandoned after 2004 between the new policy and the status quo.
To calculate the net effect of new policy on innovation and R&D we need to take one more step and calculate the cumulative difference in R&D spending between the two policies. The trial length and R&D spending by phase (shown in Table 1 of the text) are used to apportion annual R&D spending for the nine-year period comprising the clinical, regulatory and post-approval phases of development. Within phases, the R&D spending for that phase is equally apportioned across the years in the phase. The annual spending is shown in Table A6.
Table A6
The annual R&D spending patterns are combined with the timing and magnitude of the additional abandoned drugs shown in Table A5 to calculate the change in abandoned R&D spending that results from the implementation of the new pricing policy. The results are shown in Table A7.
Table A7
Appendix II
The IMPLAN Model
The IMPLAN economic impact modeling system is a product of Minnesota IMPLAN Group, Inc.
IMPLAN provides regional industry multipliers, which enable the user to provide detailed analyses of the direct, indirect and induced economic impacts on the local economy of a change in final demand for certain industries.
IMPLAN multipliers are designed to model a variety of scenarios and are traditionally used to model a shock to a regional economy. Examples of uses of the model include opening or closing military bases, new energy facilities, new sports stadiums, opening or closing manufacturing plants and airport or port facilities. All these scenarios are modeled by estimating changes in final demand by industry and entering them into the IMPLAN model for the region.
Any systematic analysis of economic impacts must account for the inter-industry relationships within a region. IMPLAN, accounts for inter-industry relationships through the use of a regional transaction table that is algebraically manipulated to produce a set of regional multipliers.
IMPLAN captures the direct effects of changes in final demand and local purchases made by local companies as a result of this increase in final demand. Because IMPLAN is based on regional industry multipliers it will also capture the ancillary effects arising from the income earned from the local companies' input purchases.
IMPLAN is based on a national transaction table that is regionally adjusted through the use of Regional Purchase Coefficients (RPC). RPC's represent the portion of local demand purchased from local producers. Once the transaction table is regionalized, a coefficient matrix is derived by dividing each industry column by the column total. This coefficient matrix is also called the A matrix. Through the algebraic manipulation performed below the regional multipliers are derived:
![]()
where
X = Industry output,
I = Identity matrix,
A = A matrix,
Y = Final Demand.
This analysis accounts for changes in Y , in the form of R&D spending. For the purposes of this study, the IMPLAN model is used to determine how the loss in R&D spending translates into value added and employment losses throughout the economy.