Introduction
Over the past 15 years perhaps no single economic issue has been the cause of more controversy than the capital gains tax. Ever since the capital gains tax rate was raised from 20 to 28 percent as part of the 1986 Tax Reform Act, Republicans and many centrist Democrats tried repeatedly to enact a capital gains tax cut to stimulate job creation and economic growth. For 10 years those efforts were stymied by the criticism that the tax cut would be a “ giveaway to the rich.”
In 1997 the political logjam was finally broken. The dramatic results proved the critics of the capital gains cut wrong; investment, new business creation, economic growth, and job creation soared to record levels, and the United States enjoyed historic prosperity. Federal receipts from the capital gains tax cut of 1997 doubled after four years. But now, due to a variety of reasons, the economy has again slowed, and is in need of a stimulus. We contend the most effective stimulus measure would be to again cut the capital gains tax rate.
Despite the high profile of this tax issue in Washington, many Americans still have little awareness of why the tax treatment of capital gains should matter to them. This study is an attempt to make the capital gains tax understandable and relevant to ordinary American workers. We intend to walk the reader through the basics of the capital gains tax. Here are some of the questions this study addresses:
- What is capital?
- What is a capital gain?
- Why is the capital gains tax important to the U.S. economy?
- How does the capital gains tax affect the typical American worker?
- Who pays the capital gains tax? Is it a rich man’s tax?
- Would a capital gains tax cut increase the budget deficit?
- How does the U.S. capital gains tax compare with those of other nations?
- How would a capital gains tax cut affect jobs and wages?
To answer those questions, this guide synthesizes a large number of studies of the issue and presents the arguments for and against the proposed tax cut. It is our conclusion from reviewing the historical evidence and more than 50 studies that reducing the capital gains tax to 10% would
- Increase stock values.
- Increase the rates of capital formation, economic growth, job creation, and real wages over the next five to ten years.
- Lead to very minimal short-term and long-term revenue losses for the government.
- Help entrepreneurs raise money for new ventures and products.
- Promote a more efficient flow of capital in the financial markets by reducing the lock-in effect of the capital gains tax.
An even more economically compelling reform would be to eliminate the capital gains tax entirely. Abolishing the capital gains tax would promote entrepreneurship, business creation, U.S. competitiveness, and higher wages for American workers—especially for the most economically disadvantaged among us.
Capital Gains Tax: The Current Context
Since the events of September 11, there has been a broad political consensus that the Congress must pass an economic recovery package to stimulate the moribund U.S. economy. Before the attack, our economy was already at little more than zero growth, according to the most recent estimate of second-quarter gross domestic product. In fact, an analysis by former Reagan administration economist Larry Kudlow has found that in the first half of 2001, the economy was in a recession when government was taken out of the equation.1 That is to say, GDP minus the government spending was negative in the first half of 2001.
All of the major economic signs since September 11 have been decisively negative. Consumer confidence has dropped to its lowest level in six years. Unemployment claims have surged to their highest levels since the mid 1990s. The biggest of all has been the stock market dive. In the first few weeks after the terrorist attacks, the Dow Jones lost more than 1,000 points, which translates into a $1 trillion loss of wealth for Americans. Since the peak of the market in early 2000, American investors have lost some $4 trillion in wealth.
In this economic environment, most Republicans and conservative Democrats have suggested a capital gains tax cut to help reverse the losses of the past few weeks and past year and a half. Yet capital gains cuts are still derided as a windfall to the rich. Alan Greenspan has said that a capital gains cut would be good for the economy in the long term, but would not provide much immediate help. He has the story only half right.
The arguments that opponents of a capital gains tax cut have made are the following:
-
1. It will not stimulate the economy right now when the help is needed most.
2. Capital gains cuts will only benefit wealthy stock owners. Most capital gains taxes are paid by Americans with incomes of more than $100,000.
3. The problem with the economy is low consumer spending, not low investment levels.
4. A capital gains cut may induce more selling and therefore a reduction in the stock market.
5. A capital gains tax cut would increase the budget deficit. If a capital gains tax cut reduces revenues and contributes to a federal budget deficit, then savings and investment in the United States might actually fall after the tax cut. This is an argument that has been made most recently by former Clinton administration Treasury Secretary Robert Rubin. Rubin believes that reducing debt should be a higher policy priority than cutting capital gains taxes.
Each of these objections is addressed and refuted in the sections that follow.
What Is the Capital Gains Tax?
A capital gain is income derived from the sale of an investment.2 A capital investment can be a home, a farm, a ranch, a family business, or a work of art, for instance.3 In most years slightly less than half of taxable capital gains are realized on the sale of corporate stock. The capital gain is the difference between the money received from selling the asset and the price paid for it.
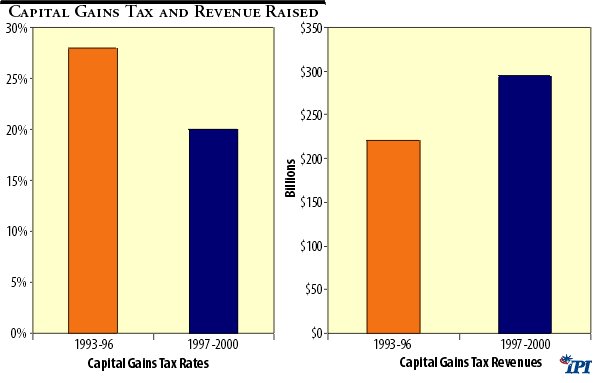
For all the controversy surrounding the tax treatment of capital gains, that tax brings in surprisingly little revenue for the federal government. In the early 1990s capital gains tax collections amounted to between $25 billion and $30 billion a year. Since 1997, when the capital gains rate was cut to 20%, receipts have skyrocketed to over $100 billion in 1999. But, even with this substantial increase, capital gains taxes are just 10 percent of personal and corporate income tax receipts and just 6 percent of total federal revenues. Even if the capital gains tax were abolished entirely, and there were no offsetting receipts, the federal government would still collect 94 percent of its total tax receipts each year.
Table 1
1999 Sources of Federal Revenue
|
Revenue Source
|
Billions of 1999 Dollars
|
| Capital Gains Tax |
110
|
| Corporate Income Tax |
184
|
| Personal Income Tax |
880
|
| Social Security Taxes |
612
|
| Total Revenues |
1,827
|
| Source: Historical Tables: Budget of the United States Government, Fiscal Year 1999 (Washington: Government Printing Office, 1996), Table 2.1, p. 22.Note: Column does not add because all sources of federal revenue are not shown. |
The capital gains tax is different from almost all other forms of federal taxation in that it is a voluntary tax. Since the tax is paid only when an asset is sold, taxpayers can legally avoid payment by holding on to their assets—a phenomenon known as the “lock-in effect.” Today there are still trillions in unrealized capital gains that have not been taxed. Over the past 40 years the appreciation of capital assets has outpaced realized capital gains 40-fold. That suggests that a capital gains tax reduction has the potential of “unlocking” hundreds of billions of dollars of stored up wealth.4
There are many unfair features embedded in the current tax treatment of capital gains. One is that capital gains are not indexed for inflation: the seller pays tax not only on the real gain in purchasing power but also on the illusory gain attributable to inflation. The inflation penalty is one reason that, historically, capital gains have been taxed at lower rates than ordinary income. In fact, Alan Blinder, now a member of the Federal Reserve Board, noted in 1980 that, up until that time, “most capital gains were not gains of real purchasing power at all, but simply represented the maintenance of principal in an inflationary world.”5
Another unfairness of the tax is that individuals are permitted to deduct only a portion of the capital losses that they incur, whereas they must pay taxes on all of the gains. That introduces an unfriendly bias in the tax code against risk taking.6 When taxpayers undertake risky investments, the government taxes fully any gain that they realize if the investment has a positive return. But the government allows only partial tax deduction (of up to $3,000 per year) if the venture goes sour and results in a loss.
There is one other large inequity of the capital gains tax. It represents a form of double taxation on capital formation. This is how economists Victor Canto and Harvey Hirschorn explain the situation:
-
A government can choose to tax either the value of an asset or its yield, but it should not tax both. Capital gains are literally the appreciation in the value of an existing asset. Any appreciation reflects merely an increase in the after-tax rate of return on the asset. The taxes implicit in the asset’s after-tax earnings are already fully reflected in the asset’s price or change in price. Any additional tax is strictly double taxation.7
Take, for example, the capital gains tax paid on a pharmaceutical stock. The value of that stock is based on the discounted present value of all of the future proceeds of the company. If the company is expected to earn $100,000 a year for the next 20 years, the sales price of the stock will reflect those returns. The “gain” that the seller realizes from the sale of the stock will reflect those future returns and thus the seller will pay capital gains tax on the future stream of income. But the company’s future $100,000 annual returns will also be taxed when they are earned. So the $100,000 in profits is taxed twice—when the owners sell their shares of stock and when the company actually earns the income. That is why many tax analysts argue that the most equitable rate of tax on capital gains is zero. 8
In addition to the federal tax levy on capital gains, many states impose their own capital gains tax. In high-tax states, such as California, Montana, and Rhode Island, the combined federal-state capital gains rate can reach 40 percent.9
Table 2
States With The Highest Capital Gains Taxes
|
State
|
Rate*
|
| Montana |
30%
|
| District of Columbia |
29.5%
|
| Oregon |
29%
|
| Iowa |
28.98%
|
| Maine |
28.5%
|
| Idaho |
28.1%
|
| California |
28%
|
| Hawaii |
27.25%
|
| Minnesota |
27.05%
|
| Source: American Council for Capital Formation, http://www.accf.org/ACCFStateCapGains.pdf*Married, filing jointly with $60,000 in annual income and capital gains of $10,000. Includes top federal marginal capital gains rate of 20 percent. |
The Evidence From The 1997 Capital Gains Tax Cut
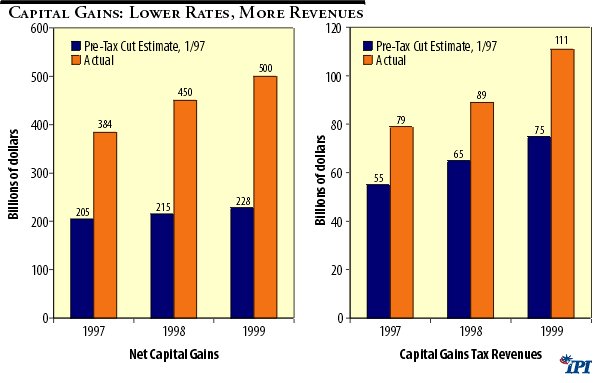
Perhaps the most persuasive case for cutting the capital gains tax comes from the most recent rate cut of 1997. That rate cut did not lead to any of the revenue losses that had been expected. According to Treasury Department tax collection data, in 1996, the year before the capital gains tax rate cut from 28 to 20 percent, the total amount of net capital gains on assets sold was $260 billion. A year later capital gains had mysteriously jumped to $400 billion. (The capital gains tax cut was retroactive to May of 1997.)In 1998 they climbed to $450 billion. In 1999 total capital gains exceeded $500 billion.
The Treasury Department data also indicates that capital gains revenues have exploded. In 1996 the last year with the 28 percent rate, the government collected $62 billion in capital gains receipts. Look what has happened since:
|
Year
|
Tax Rate
|
Capital Gains Taxes
|
|
1996
|
28%
|
$62 billion
|
|
1997
|
20%
|
$79 billion
|
|
1998
|
20%
|
$89 billion
|
|
1999
|
20%
|
$109 billion
|
The lower tax rates changed people’s economic behavior, stimulated economic growth, and thus created more, not less tax revenues. This was not a temporary one-year effect.
Nor was it an historical aberration. After the 1981 capital gains cut from 28 to 20 percent, the cap gains revenues leapt from $12.5 billion in 1980 to $18.5 billion by 1983—a 48 percent increase. More importantly slashing the income and capital gains tax rates in 1981 helped launch what we now appreciate as the greatest and longest period of wealth creation in world history. In 1981 the stock market was cratered at about 1,000, compared to 10,500 today.
Conversely, the perverse action in 1986 of raising the capital gains tax, caused total asset sales of taxable capital gains to evaporate from $326 billion in 1986, the year before the capital gains rate was raised (from 20 back to 28 percent), to $154 billion in 1989.
How is it that lower capital gains taxes lead to more revenues? The capital gains tax is a voluntary and easily avoided tax. When the tax rate is high, investors simply delay selling their assets—stocks, properties, businesses, etc.—to keep the tax collector away from their door. When the capital gains tax is cut, asset holders are inspired to sell. Moreover, because a lower capital gains tax substantially lowers the cost of capital, it encourages risk taking and causes the economy to grow faster thus raising all government receipts in the long term. So the torrent of new revenues into the government coffers is really no mystery at all. In fact it was entirely predictable.
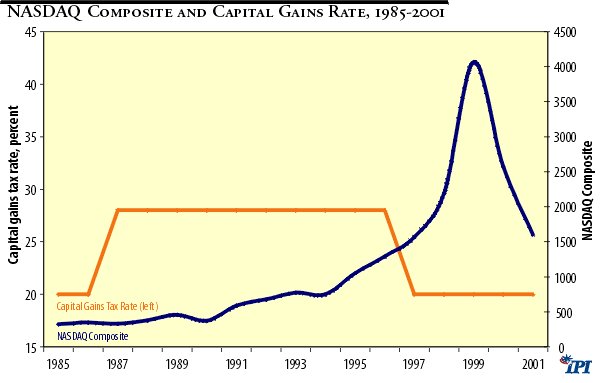
So then why did so few predict it? The answer is that the government’s forecasting models are flawed. The chart below shows that capital gains realizations and revenues are much higher than forecasted. A lot of the increase was due to the sizzling stock market over the past three years. But a lower capital gains cut increases the after tax return on capital and thus helped create the strong market. Hint: One sure way to pump new life into the NASDAQ is to cut the capital gains tax to 10 percent.
Figure 1
The supply side critics were famously wrong in their predictions about the fiscal impact of a capital gains tax cut. Michael Kinsley of Slate and others wrote that a capita gains cut would reduce federal revenues by $75 billion over five years. Instead, the rate cut is on pace to have raised capital gains revenues by $100 billion. What accounts for this giant forecasting error? The reliance on static revenue forecasting and the failure to take account of the economic adrenaline that a capital gains tax cut can provide.
The lesson here is that the impact of tax changes cannot be properly predicted without assessing how the tax policy changes will influence the behavior of workers, entrepreneurs and investors. All over the world tax rates are falling as political leaders realize that high tax rates do not redistribute income, they redistribute people. The static economic model used by the Joint Tax Committee and the Congressional Budget Office should be discarded because it has proven again and again that it has no predictive powers.
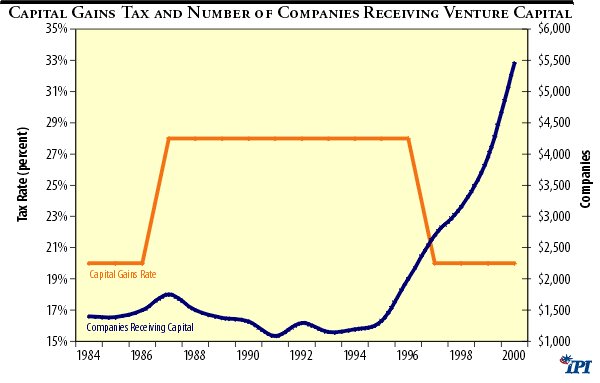
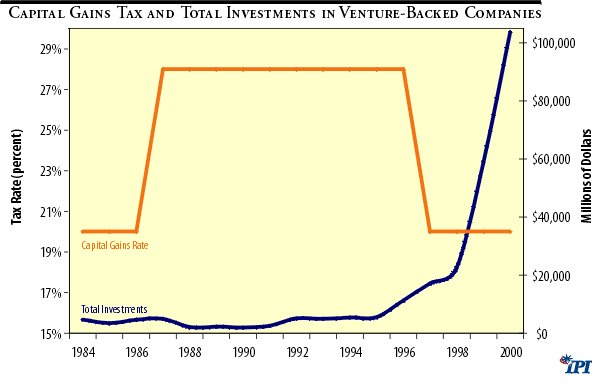
The capital gains tax cut of 1997 corresponded with two other positive economic trends. First, risk capital funding for new business start-ups increased by nearly 50 percent between 1997 and 2000. If we want an investment-led recovery, then capital gains cuts are crucial. Here is the data for the venture capital funding explosion after the capital gains cut:10
|
Year
|
Venture Capital Funding $
|
# of Companies Receiving Funds
|
|
1996
|
$11,277
|
2004
|
|
1997
|
$27,207
|
2696
|
|
1998
|
$22,576
|
3155
|
|
1999
|
$59,164
|
3956
|
|
2000
|
$103,849
|
5458
|
Second, the stock market soared after the capital gains cut of 1997. In 1997, for example, the NASDAQ stood at 2,400. Three years later it was at 5,000. It now sits around 1500. Nothing could pull the NASDAQ out of its gloom more efficaciously than a tax rate cut made retroactive to the beginning of 2001.
Figure 2
Will a Capital Gains Tax Cut Increase Investment and Capital Formation?
Virtually all economists agree that capital formation is essential to restoring growth to the American economy. The real issue is, will a lower capital gains tax rate raise capital formation appreciably?
Why should we expect lower capital gains tax rates to inspire a chain reaction of greater investment spending and higher asset values? The straightforward answer is that when Congress chops the capital gains tax, it increases the after tax rate of return on real assets (like plant, equipment, and technology) and thus the value of the stock rises. Remember: a capital gains tax is merely a punitive second layer of tax: the value of a capital asset is no more nor less than the discounted present value of the revenue stream it produces. Under a rational tax system, we would tax the income stream or the asset value, but not both.
U.S. industry experienced a rise in the cost of capital as a result of the changes in the 1986 Tax Reform Act. Although a number of factors (including the institution of the corporate alternative minimum tax, changes in depreciation allowances, and elimination of the Investment Tax Credit) have contributed to rising capital costs in the United States, one of the most important tax penalties on capital was the hike in the capital gains tax.11 Altogether, the added tax burdens imposed on capital investments in1986 widened the gap between the income derived from a capital project, such as investment in a new plant, and the after-tax return to the firm and its stockholders.
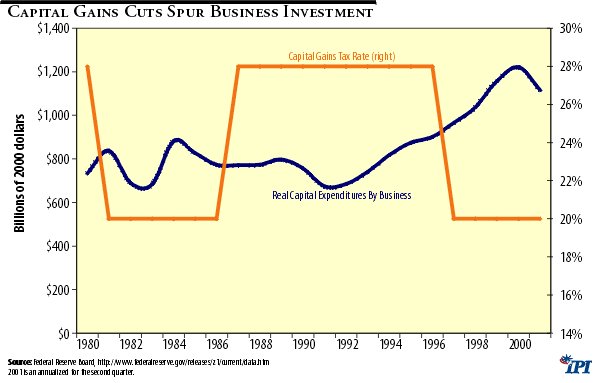
America’s unfavorable tax treatment of capital investment has caused an observable slowdown in the rate of growth in U.S. capital formation since 1986. Between 1986 and 1992 business fixed investment fell by half. Business investment in equipment fell by one-third over the same period. After the 1997 capital gains cut, investment rebounded somewhat, but really accelerated with the 1997 cut. Now it is starting to fall again, as the chart shows.
Figure 3
A U.S. Chamber of Commerce Foundation study estimated the impact of a proposal to reduce the top capital gains rate to 15 percent. The research was conducted by economists Patrick Hendershott and Yunhi Won of Ohio State University with Eric Toder of the Treasury of New Zealand. The researchers employed a modified version of the General Equilibrium Model of Differential Asset Taxation, which attempts to capture the effect on various types of capital investment of changes in the tax treatment of various assets and differences in marginal tax rates among taxpayers.12
In response to a rollback of the capital gains tax to 15 percent, the model finds that the taxable bond rate rises, the cost of capital to the corporate sector and non-corporate business sector falls, and the tax-exempt bond rate rises. The researchers found that those economic responses to the tax cut have the following consequences for capital formation:
-
“The size of the business capital stock, both corporate and non-corporate, expands relative to the size of the capital stock devoted to housing and consumer durables and to state and local capital. In the present model with a fixed aggregate capital stock, these results imply that the business capital stock increases and the other elements of the capital stock decline. In a growth context, of course, the business capital stock would simply grow faster than other components of the capital stock”.13
Will a Capital Gains Tax Cut Enhance U.S. Global Competitiveness?
One indication of which nations will prosper economically in the future and which will fall behind is the flow of international capital. In the 1980s after marginal income tax rates were reduced by more than one-third, the United States attracted a net of nearly one-half trillion dollars of foreign capital. That is, foreigners invested $520 billion more in the United States than U.S. citizens and companies invested abroad. Since 1986 the rate of foreign capital investment in the United States has substantially slowed. This table shows net investment in the United States from 1962 to 2000.14
Table 3
Net Private Foreign Capital Investment in the U.S., 1962-2000
|
Year
|
Net Private Foreign Investment ($)
|
Year
|
Net Private Foreign Investment ($)
|
|
1962
|
3,982
|
1981
|
25,803
|
|
1963
|
4,755
|
1982
|
22,413
|
|
1964
|
6,067
|
1983
|
-11,162
|
|
1965
|
4,729
|
1984
|
-83,098
|
|
1966
|
2,014
|
1985
|
-109,090
|
|
1967
|
3,458
|
1986
|
-85,419
|
|
1968
|
-3,070
|
1987
|
-114,825
|
|
1969
|
-5,796
|
1988
|
-101,366
|
|
1970
|
10,779
|
1989
|
-65,277
|
|
1971
|
16,849
|
1990
|
-14,122
|
|
1972
|
1,939
|
1991
|
-10,298
|
|
1973
|
8,024
|
1992
|
-45,243
|
|
1974
|
9,947
|
1994
|
-28,157
|
|
1975
|
26,737
|
1995
|
-33,302
|
|
1976
|
25,672
|
1996
|
29
|
|
1977
|
16,214
|
1997
|
7,629
|
|
1978
|
26,844
|
1998
|
43,430
|
|
1979
|
8,760
|
1999
|
152,425
|
|
1980
|
31,036
|
2000
|
141,858
|
| Source: U.S. Department of Commerce, Bureau of Economic Analysis. |
The reduction in capital inflows in the early 1990s was due in part to higher income tax rates since 1990 and higher capital gains tax rates since 1986. Today the United States is still burdened with one of the highest capital gains taxes of any industrial nation. Many of America’s principal trading partners tax capital gains at a lower rate than does the United States. In fact, many of our major international competitors—including the Netherlands, Hong Kong, and Taiwan—impose no tax on long-term capital gains. Australia and the United Kingdom have higher capital gains tax rates, but because both those nations allow for indexing of the base, the effective tax rate may still be lower than the U.S. tax rate.
Hideyuki Aizawa, speaking for Japan’s ruling Liberal Democratic Party’ ;s tax system research council, announced on October 3:
-
“Investors will be able to pay 10 percent tax on equity capital-gains if they sell stocks after holding them for more than one year, instead of paying a 20 percent tax rate on listed stocks or 26 percent on unlisted securities. The 10 percent tax incentive will be effective for three years from January 2003 but I think the expiration will eventually be extended indefinitely.” 15
This policy change by the Japanese makes the competitiveness rationale for cutting capital gains rates in the US all the more compelling. Early indications are that the Japanese announcement is driving a flow of capital back into Japan’s beleaguered stock exchange.
Table 4
Capital Gains Tax Rates around the World (assets held more than one year)
| Country |
Capital Gains Tax Rate (percent)
|
Note
|
| Argentina |
0.0
|
|
| Australia |
48.5
|
asset cost is indexed |
| Belgium |
0.0
|
|
| Brazil |
15.0
|
|
| Canada |
23.5
|
|
| Chile |
45.0
|
annual exclusion of $6,600 |
| China |
20.0
|
shares traded on major exchange exempt |
| Denmark |
40.0
|
shares valued at less than $16,000 exempt if held 3+ years |
| France |
26.0
|
annual exclusion of $8,315 |
| Germany |
0.0
|
|
| Hong Kong |
0.0
|
|
| India |
20.0
|
|
| Indonesia |
0.1
|
|
| Italy |
12.5
|
|
| Japan |
20.0
|
announced reduction to 10 |
| Korea |
20.0
|
shares traded on major exchange exempt |
| Mexico |
0.0
|
|
| Netherlands |
0.0
|
|
| Poland |
0.0
|
|
| Singapore |
0.0
|
|
| Sweden |
30.0
|
|
| Taiwan |
0.0
|
|
| United Kingdom |
40.0
|
shares valued at less than $11,225 exempt |
| United States |
20.0
|
|
| Average |
15.9
|
| Source : American Council for Capital Formation. |
Capital Gains Tax Cuts and Business Creation
One of the potential benefits from reducing the capital gains tax is to divert investment funds to new business start-ups, particularly in the high-tech industries—where investments tend to involve high risk but have potentially large payoffs. That is particularly vital to the economy because studies indicate that small businesses (20 employees or fewer) create anywhere from 50 percent to 80 percent of all new jobs in the United States.16
The evidence from the past 20 years shows compellingly that past reductions in the capital gains tax rates (1978, 1981, and 1997 for instance) stimulated the financing and start-up of new businesses, while new business activity stalled after increases in capital gains taxes (1969 and 1986). We compared three separate measures of new business generation—the number of initial public stock offerings (IPOs), the dollars raised from those IPOs, and the dollars committed to venture capital firms—with fluctuations in the capital gains tax rate between 1969 and 2000.17 The data show the following relationships:
- The number of new public stock offerings fell from 780 in 1969 to 34 in 1976; over that same period the maximum capital gains rate rose from 27.5 percent to 49 percent. Between 1986 (the year before the capital gains tax rate was increased) and 1989, the number of IPOs fell from 953 to 371—a 60 percent decline.18
- New commitments to venture capital firms accelerated from $68 million in 1977 when the top marginal rate was 49 percent to $5.1 billion by 1983 when the rate had been dropped to 20 percent. That was a 700 percent increase in capital raised for new firms.
- After the 1987 capital gains tax rate hike, the number of companies receiving venture capital funding steadily declined. In 1986, 1,512 firms received funding. That number had fallen to 800 by 1991. It remained relatively low until it skyrocketed following the 1997 capital gains cut.
- And in 1986 real venture capital funding for promising young firms was $3.4 billion, but the level fell to $1.41 billion in 1991—a 59 percent reduction.19
- New business formation dramatically increased following the 1997 cut of the top capital gains rate. Between 1997 and 2000, the amount of money raised in IPOs more than doubled, while venture capital commitments increased by a factor of 6.
Table 5
Relationship between the Capital Gains Tax Rate and
Measures of New Business Formation
|
Year
|
Top Capital Gains Rate (%)
|
Initial Public Offerings
|
Dollars Raised (millions)
|
Commitments to Venture Capitalists (millions)
|
|
1969
|
27
|
780
|
2,605
|
506
|
|
1970
|
32
|
358
|
780
|
272
|
|
1971
|
39
|
391
|
1,665
|
252
|
|
1972
|
45
|
562
|
2,724
|
157
|
|
1973
|
45
|
105
|
330
|
133
|
|
1974
|
45
|
9
|
51
|
124
|
|
1975
|
45
|
14
|
264
|
20
|
|
1976
|
49
|
34
|
237
|
93
|
|
1977
|
49
|
40
|
151
|
68
|
|
1978
|
48
|
42
|
247
|
980
|
|
1979
|
28
|
103
|
429
|
449
|
|
1980
|
28
|
259
|
1,404
|
961
|
|
1981
|
24
|
438
|
3,200
|
1,628
|
|
1982
|
20
|
198
|
1,334
|
2,119
|
|
1983
|
20
|
848
|
13,168
|
5,098
|
|
1984
|
20
|
516
|
3,934
|
4,590
|
|
1985
|
20
|
507
|
10,450
|
3,502
|
|
1986
|
20
|
953
|
19,260
|
4,650
|
|
1987
|
28
|
630
|
16,380
|
4,900
|
|
1988
|
33
|
435
|
5,750
|
2,100
|
|
1989
|
33
|
371
|
6,068
|
2,200
|
|
1990
|
28
|
276
|
4,519
|
2,000
|
|
1991
|
28
|
367
|
16,420
|
2,511
|
|
1992
|
28
|
509
|
23,990
|
5,178
|
|
1993
|
28
|
605
|
37,000
|
4,963
|
|
1994
|
28
|
500
|
25,000
|
5,351
|
|
1995
|
28
|
500
|
28,000
|
5,608
|
|
1996
|
28
|
775
|
50,000
|
11,278
|
|
1997
|
20
|
575
|
40,000
|
17,207
|
|
1998
|
20
|
350
|
33,000
|
22,576
|
|
1999
|
20
|
492
|
63,000
|
59,164
|
|
2000
|
20
|
422
|
97,000
|
103,849
|
Figure 4
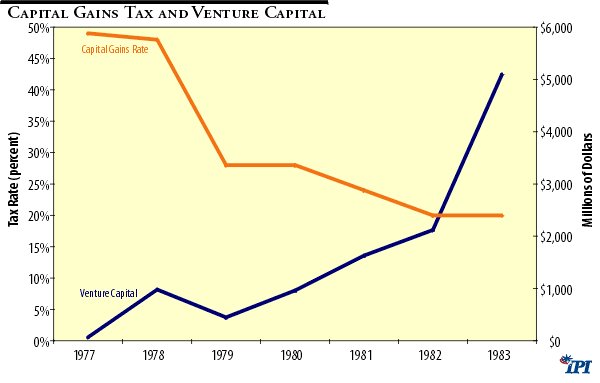
Figure 5
Venture capital funds are the economic lifeblood of high-technology companies in industries that are of critical importance to U.S. international competitiveness: computer software, biotechnology, computer engineering, electronics, aerospace, pharmaceuticals, and so forth. The high capital gains tax rate appears to have contributed to the drying up of funding sources for those promising new frontier firms.20
Figure 6
Not only are there more small business start-ups and IPOs during periods of low capital gains taxes, but also the stock of smaller firms appears to outperform that of large corporations during periods of low capital gains taxes. New research by Merrill Lynch (1995) demonstrates that over the past 25 years small and medium-sized firms have benefitted more from reductions in capital gains taxes than have large, established corporations. In its innovative study, Merrill Lynch constructed an index of the performance of small-capitalization stocks relative to that of large corporate stocks (measured using the Standard & Poor’s 500 index). That ratio was then compared to the capital gains tax rate. We looked at this ratio over the period 1971–2001. Although the stock prices of firms of all sizes tend to be sensitive to changes in capital gains tax rates,
-
“…smaller capitalization stocks have even greater sensitivity because they tend to be capital gains, rather than income, oriented. Our regression work suggests that every cut of five percentage points in the capital gains tax rate could translate into approximately 12.5 percentage points of additional return for smaller stocks [above the return for other stocks].” 21
Figure 7
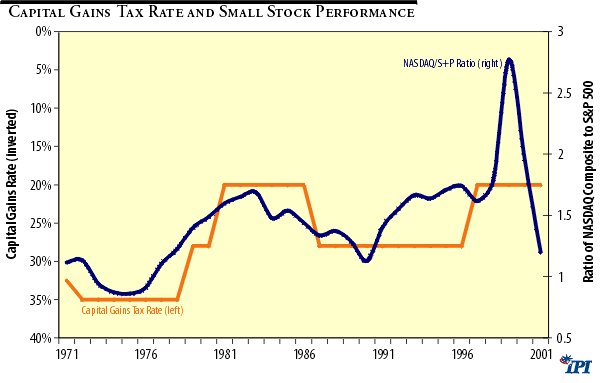
A 1997 study by Prudential Securities has found the same relationship. Small cap stocks do better when the capital gains tax cut is low.
To summarize, a capital gains tax cut is critical to American entrepreneurs and small business owners because
1. Most high-risk small business start-ups receive the bulk of their seed money from informal investors who are subject to the capital gains tax;
2. Over the past 25 years higher capital gains taxes have been associated with a drying up of investment capital for small and growing businesses, and lower capital gains taxes have produced substantial increases in business start-ups and financings; and
3. A capital gains tax cut will particularly benefit America’s new high-technology companies, which have a voracious appetite for investment capital in their start-up stages; those firms tend to be financed by a combination of informal investors and venture capital—both of which are highly influenced by the capital gains tax rate.
How Do Capital Gains Taxes Affect Workers?
Assuming that the capital gains tax reduction would lower the cost of capital and stimulate additional investment and business formation, what would be the effect on jobs?
The 1990 survey by the American Electronics Association, the National Venture Capital Association, and Coopers & Lybrand provides one rough estimate. It discovered that
-
“For all of the 410 companies formed between 1966 and 1985, each of the 190,000 total jobs created required an average of $31,850 in capital investment. [Today that estimate is up to about $52,000.]” 22
In the long term the real impact on workers of a change in the capital gains tax is reflected not in jobs but in wages. Consider the chain of events when the capital gains tax is raised:
-
1. The higher tax lowers the expected after-tax return for the owner of capital.
2. The lower rate of return on capital leads businesses to reduce their purchases of capital—equipment, computers, new technologies, and the like. In the very short term firms may use less capital and more labor to produce goods and services.
3. Because capital is more expensive, the cost of production rises and output falls.
4. Because workers have less capital to work with, the average worker’s productivity—the amount of goods and services he or she can produce in an hour—falls.
5. Because wages are ultimately a function of productivity, the wage rate will eventually fall.
That is not just ivory-tower economic theory. Over the past 30 years the real wage rate paid workers has tracked the capital/labor ratio with very little variance, as the figure showed earlier in this study.
The capital gains tax impacts middle-income workers now more than ever given the huge expansion of stock ownership over the past two decades. The chart below shows that whereas only 1 in 5 Americans owned stock in the 1970s, today almost half of all Americans are shareholders.
The Revenue Impact Of A Capital Gains Tax Cut
The impact of a capital gains tax cut on federal revenue collections has long been an issue of contentious debate—both in the academic literature and in public policy circles. In the current era of emphasis—at least rhetorical emphasis—in Washington on maintaining the surplus and paying down debt, it is predictable that the budgetary effect of capital gains tax changes would dominate public discussion.
In theory, a capital gains tax cut would create several countervailing positive and negative revenue effects. The revenue-losing effects are
-
1. A static revenue loss from asset sales that would have occurred without the tax cut but benefit from the lower rate;
2. A reduction in trading in anticipation of changes in the tax rate, as was witnessed in 1986; and
3. A paper shifting of reported income from ordinary sources—such as wages taxed at the “normal” rate—to capital gains income with lower rates.
The proposal would gain revenue through the following mechanisms:
-
1. A short-term unlocking of assets that would not have been sold otherwise (and might never have been sold but, instead, bequeathed at death);
2. An increase in reporting of income (i.e., less tax evasion);23
3. An increase in the value of stock and other capital assets traded over the long run; and
4. An increase in long-term economic growth from the higher capital formation, which would raise tax collections from income taxes, payroll taxes, and other sources.
The issue is, which effects are dominant—the revenue—losing ones or the revenue-gaining ones? Unfortunately, the academic literature and the economic modeling forecasts show no consensus on the answer to that question. Regression analysis has validated statistically that the 1969 rate increase lost revenue, the 1978, 1981, and 1997 rate reductions gained revenue, and that 1986 rate hike has lost revenue.24
But the idea that lower rates generated higher revenues is by no means universally accepted. A time-series regression analysis by Urban Institute economist Joseph Minarik contradicts the favorable assessment of the 1978 and 1981 tax cuts. According to Minarik,
-
“The 1978 law experience gives no backing to claims of an ongoing revenue pickup [from the tax cut].…The 1981 capital gains tax cut was a revenue loser from day one. The heart of the issue is revenue. And here there is no doubt.” 25
Economist Jane Gravelle of the Congressional Research Service dismisses the notion that a tax cut will raise revenues. Last February she told the Senate Finance Committee,
The new evidence suggests that the revenue maximizing tax rate is probably higher, perhaps much higher, than current tax rates. It is unlikely that any capital gains tax cut, no matter how small, would fail to lose revenue.26
Many other studies predict a modest to very positive long-run revenue gain from a 10 percent capital gains tax rate.27 What is one to make of all the conflicting research?
We believe that the only truly reliable predictor of the future is the past. And here the evidence is fairly straightforward. Over the past 30 years a consistent pattern has emerged: every time the capital gains tax has been cut, capital gains tax revenues have risen. Every time the capital gains tax has been raised, capital gains tax revenues have fallen. Here are some prominent examples:
- In 1968 real capital gains tax receipts were $33 billion (1992 dollars) at a 25 percent tax rate. Over the next eight years the tax rate was raised four times, to a high of 35 percent. Yet with the tax rate almost twice as high in 1977 as it had been in 1968, real capital gains tax revenues were only $24 billion—27 percent below the 1968 level.
- In 1978, when the top marginal tax rate was 35 percent, $24 billion of capital gains tax was collected. By 1984, after the tax had been cut to 20 percent, revenues from the lower tax rate were $32 billion—25 percent above their 1978 level.
- In 1986 the tax rate increased by 40 percent, from 20 to 28 percent. Did tax revenues climb by 40 percent? Just the opposite occurred. In 1990 the federal government took in 10 percent less revenue at the 28 percent rate than it did in 1985 at the 20 percent rate. In 1991 and again in 1992 the government collected 20 percent less revenue than it did in 1985.
- In 1996, the year before the capital-gains tax rate was cut from 28 to 20 percent, net capital gains on assets sold were roughly $ 250 billion. A year later, capital gains had leapt to $ 383 billion. (The tax cut was retroactive to May of 1997.) In 1996, the Treasury collected roughly $60 billion in capital-gains revenues. In 1997, those tax payments soared to $75 billion. As the chart shows, capital gains revenues for the period from 1997–2000 were more than double what they were during the preceding period.28 For opponents of supply-side economics, who doubt that tax rates affect behavior, this is hard to explain. Nonetheless, opponents of another capital gains tax cut continue to use static models to predict a large revenue loss from a new round of capital gains cuts.
Table 6
Estimated Total Capital Gains Taxes (2000 dollars)
|
Year
|
Capital Gains Tax Rate
|
Estimated Capital Gains Taxes
|
Year
|
Capital Gains Tax Rate
|
Estimated Capital Gains Taxes
|
|
1942
|
25
|
1,278
|
1969
|
25
|
32,962
|
|
1943
|
25
|
2,992
|
1970
|
29.5
|
20,176
|
|
1944
|
25
|
4,081
|
1971
|
32.5
|
27,675
|
|
1945
|
25
|
8,243
|
1972
|
35
|
32,298
|
|
1946
|
25
|
9,634
|
1973
|
35
|
28,837
|
|
1947
|
25
|
6,087
|
1974
|
35
|
20,987
|
|
1948
|
25
|
6,023
|
1975
|
35
|
19,672
|
|
1949
|
25
|
4,605
|
1976
|
35
|
24,786
|
|
1950
|
25
|
8,685
|
1977
|
35
|
29,507
|
|
1951
|
25
|
7,860
|
1978
|
35
|
29,873
|
|
1952
|
26
|
6,784
|
1979
|
28
|
37,533
|
|
1953
|
26
|
5,913
|
1980
|
28
|
35,054
|
|
1954
|
26
|
8,858
|
1981
|
24
|
34,426
|
|
1955
|
25
|
12,711
|
1982
|
20
|
29,371
|
|
1956
|
25
|
11,973
|
1983
|
20
|
20,917
|
|
1957
|
25
|
9,295
|
1984
|
20
|
39,653
|
|
1958
|
25
|
10,689
|
1985
|
20
|
47,837
|
|
1959
|
25
|
15,275
|
1986
|
20
|
92,920
|
|
1960
|
25
|
12,879
|
1987
|
28
|
56,220
|
|
1961
|
25
|
18,709
|
1988
|
33
|
63,928
|
|
1962
|
25
|
14,506
|
1989
|
33
|
56,800
|
|
1963
|
25
|
15,751
|
1990
|
28
|
43,453
|
|
1964
|
25
|
23,249
|
1991
|
28
|
34,555
|
|
1965
|
25
|
22,847
|
1992
|
28
|
38,847
|
|
1966
|
25
|
21,461
|
1996
|
28
|
62,000
|
|
1967
|
25
|
29,556
|
1997
|
20
|
79,000
|
|
1968
|
25
|
40,625
|
2000
|
20
|
118,000
|
Figure 8
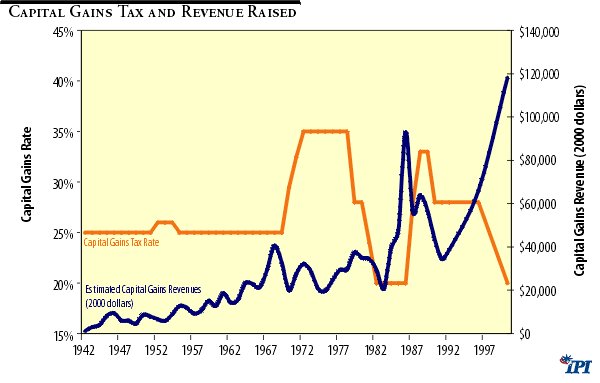
Figure 9
How Government Forecasters Get It Wrong
In an earlier discussion of the 1997 capital gains tax cut, we mentioned that the forecasts of the revenue impact of the tax change was very misleading. In fact, history proves that the Joint Tax Committee and the Congressional Budget Office almost always overestimate the revenue losses from a capital gains tax cut and overestimate the revenue gains from a capital gains increase. This is because economic growth is not accounted for in these models.
The reduction in inflation-adjusted capital gains realizations following the 1986 rate increase was massive. Capital gains realizations, adjusted for inflation, were cut in half in the six years after the 1986 capital gains rate increase took effect. Realizations, which were $213 billion the year before the rate increase, fell to $125 billion in 1990, $108 billion in 1991, and $120 billion in 1992.29 Realizations remained relatively flat and historically low until the 1997 rate cut set off another massive increase.
Clearly, investors are highly sensitive to the rate of capital gains tax when determining whether to sell stock holdings and other assets. The best evidence of that sensitivity to tax rates is that there were huge spikes in capital gains realizations in 1986 and 1997. 1986 was the last opportunity for investors to take advantage of the 20 percent capital gains tax rate before it was increased to 28 percent, and 1997 was investors’ first opportunity to take advantage of the return to a 20 percent rate.
To be sure, some of the reduction in capital gains realizations in the early 1990s was a result of the 1990–91 recession. But the figure shows clearly that the decline in capital gains realizations began in 1987—three years before the recession began. The recession accelerated the reduction in capital gains realizations, but it did not cause that trend. Moreover, the capital gains drought has persisted in the “recovery” period.
One conclusion that can be drawn, with 20–20 hindsight, from the historical data is that the CBO’s and the Joint Tax Committee’s forecasts of capital gains tax revenues and realizations were widely off the mark. As late as 1988 the CBO claimed that their computer simulations showed “a net revenue increase from the 1986 Act.”30 How could those government forecasters have been so wrong?
The CBO estimated capital gains realizations at $269 billion for 1991, and the Joint Committee on Taxation predicted realizations of $285 billion for that year. In reality, capital gains realizations were $108 billion. For 1992 the CBO predicted capital gains realizations of $287 billion; the actual figure was $126 billion. The CBO’s forecasting error from 1989–92 accounts for roughly $115 billion in lost revenues and higher than expected federal debt over that period.31
That was not the first time the static government revenue prediction models had produced erroneous forecasts of capital gains. The static models have time and again been proved deficient when later checked against actual results. The three major government forecasters, the Congressional Budget Office, the Joint Committee on Taxation, and the Treasury (all of which now insist the House capital gains tax cut will be a revenue loser), forecasted that the 1978 capital gains tax cut would produce a static revenue loss. The joint committee forecasted that the 1978 act would reduce revenues by $2 billion per year; in fact, receipts rose by $3 billion per year. The Office of Treasury Analysis estimated revenues after the 1978 cut at $6.4 billion in 1979 and $7 billion in 1980.32 The OTA was off by a factor of 50 percent: actual revenues were $10.6 billion and $11 billion, respectively.
The intent here is not to deride the government forecasters who have compiled those error-prone predictions in the past. It is to point out that the government econometricians have not learned from their mistakes. They are still using the same flawed models of behavior today that they did 10 and 20 years ago—and that we now know are wrong. The government forecasts that predict a loss of revenue simply have no historical credibility.
Alan Reynolds, chief economist with the Hudson Institute, explains the consistently misguided forecasts. Reynolds notes,
-
“All of the many studies of the revenue effect of the capital gains tax simply assume that there is no effect at all on the price of stocks and bonds, and also no effect on business investment or real GNP. That is, the revenue estimators ignore the most important effect.” 33
If the government revenue forecasters were to incorporate even modest economic growth responses into their static models and appropriately estimate the lock-in effect, the computers would spew out substantially different conclusions. That was the finding of a recent analysis by economist Martin Feldstein of the National Bureau of Economic Research on the sensitivity of government models to changes in economic growth. Feldstein concludes that if
-
“…the improved incentives for saving, investment, and entrepreneurship were to increase the annual growth rate of GNP [over five years] by even a microscopically small 4 one-hundredths of one percent—for example, from the CBO’s estimate of an average 2.44 percent real GNP growth per year to 2.48 percent—the additional tax revenue would be about $5 billion a year and would turn CBO’s estimated revenue loss into a revenue gain. In short, the potential economic gains from a capital gains [tax] reduction are substantial and the potential revenue loss is doubtful at best.…The slightest improvement in economic performance would be enough to turn [CBO’s] revenue loss into a revenue gain.” 34
In sum, if one accepts the notion that a capital gains tax cut promotes economic growth (as the evidence suggests is the case), then even the most pessimistic possible fiscal scenario is no loss of tax revenue from a tax rate cut. The more likely effect would be a substantial and permanent rise in revenues.
Is a Capital Gains Tax Cut “Fair”?
For nearly a decade the so-called tax fairness issue has dominated the capital gains tax debate. Who are the winners and who are the losers from a capital gains tax cut? Every new analysis seems to provide a different answer to that question.
A common claim by opponents of a capital gains tax cut is that “60 percent of the tax break will go to households with incomes above $200,000.” Most of the evidence, however, suggests that a rate reduction would promote tax fairness and benefit taxpayers of all income levels. There are four major reasons for that.
Economic Growth Benefits All Income Groups. Opponents of the capital gains tax cut use the equity issue as a smoke screen to avoid the real issue, economic growth. If a capital gains tax cut generates new investment and new jobs, as most of the evidence suggests, all Americans will reap the benefit. For example, when the capital gains tax rate was lowered in 1981, the incomes of all income groups rose and the unemployment rate fell by nearly 3 percentage points by 1986. The rich and the poor alike benefitted from the tax law change.
Figure 10
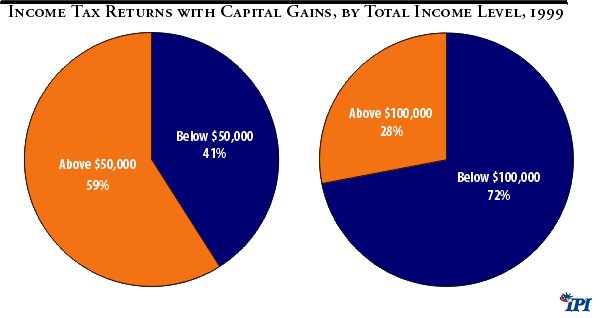
Not Just the Wealthy Realize Capital Gains Income. A capital gains tax rate reduction will reduce taxes for all income groups. Capital gains are not reported just by wealthy individuals. In fact, 1999 Internal Revenue Service data indicate that 42 percent of all returns reporting capital gains were from households with incomes below $50,000. Seventy-two percent, or 11.8 million returns, were for households with incomes below $100,000.35
Moreover, when the Joint Committee on Taxation estimates the tax burden shift caused by the entire GOP tax reduction package, the committee finds that the largest percentage tax cut accrues to families with incomes between $30,000 and $75,000. The smallest tax cut goes to those with incomes below $10,000— because those families pay very little if any taxes to begin with—and households with incomes above $200,000.36
Table 7
Effect of House Republican Tax Cut by Income Class
|
Income
|
Change in Taxes (%)
|
|
Less than $10,000
|
-2.3
|
|
$10,000-20,000
|
-3.4
|
|
$20,001-30,000
|
-3.9
|
|
$30,001-50,000
|
-4.4
|
|
$50,001-75,000
|
-4.4
|
|
$75,001-100,000
|
-4.0
|
|
$100,001-200,000
|
-3.7
|
|
$200,001 or more
|
-2.9
|
| Source : Joint Committee on Taxation, March 1995. |
But what about the CBO data that indicate that the total dollar savings from a capital gains tax cut benefit primarily the wealthiest income groups? It turns out that, because the income figures include the one-time capital gain, that deceptive statistic, almost by definition, labels anyone with a large capital gain in any given year “rich.”
A woman who has a middle income all her life but then sells her business for $150,000 when she retires is labeled “rich”—for that year— by the CBO. Similarly, a struggling farmer who sells the family farm to avoid indebtedness is labeled “rich” because the once-in-a-lifetime sale substantially inflates his income for that single year.
In the public finance literature, that is called “bunching.” Joseph Minarik, now of the Urban Institute, notes,
-
“The bunching problem arises when a taxpayer realizes a long-term gain relative to his average income. Such a taxpayer bears a far higher liability on that gain upon realization than he would under accrual taxation or a proration or averaging provision.” 37
Minarik examined IRS tax return data for 1967–73 and found that the bunching problem increased the tax liability of 88 percent of those realizing taxable capital gains over that period. More recently, the American Council for Capital Formation found that over the five-year period of 1979–83, only 16 percent of tax filers had capital gains income in each year, while almost half reported taxable gains in only one of the five years.38 When the bunching problem is accounted for, the percentage of capital gains realized by those with incomes above $200,000 falls by almost half.39
Those data reveal that for most taxpayers capital gains are an unusual occurrence and are not part of the individual’s normal annual income stream. A more meaningful measure of income, for the purposes of examining the equity effects of capital gains taxes, is “recurring income”— that is, income received on a regular or recurring basis. When income tax data excluding income from capital gains are examined, the share of capital gains income appears to be much more evenly distributed. In 1985 only one-quarter of all capital gains were realized by those with incomes above $200,000, excluding the capital gains income. Forty-five percent of the gains went to Americans with non-capital-gains incomes below $50,000.
Figure 11
Until recently, policymakers and tax experts had long recognized the bunching problem as a convincing justification for a capital gains differential. A 1923 House of Representatives report on capital gains taxes identified the full taxation of capital gains as “an injustice to the taxpayer, in that an investment frequently accumulated over a period of many years was . . . arbitrarily attributed to the year the sale took place.”40 The introduction of a differential tax rate for capital gains a three-quarters of a century ago was heralded as a victory for tax fairness. Similarly, in 1982 the CBO argued that one rationale for the then 60 percent exclusion of long-term capital gains was “to reduce the burden on a taxpayer that occurs when a capital gain accruing over several years is realized, requiring the taxpayer to pay tax at progressive rates on several years’ income all in one year.”41
Capital Gains Taxes Particularly Punish the Elderly. Bunching is most common among people entering retirement. A large percentage of capital gains beneficiaries are the elderly, who wind up selling a family business or a portfolio of stock that has accumulated over the individual’s working life and is meant to serve as a nest egg for retirement. The elderly are two and a half times more likely to realize capital gains in a given year than are tax filers under the age of 65. The elderly are also likely to derive a larger share of their income from capital gains than are younger workers. A study by the National Center for Policy Analysis examining IRS data from 1986 found that the average elderly tax filer had an income of $31,865, 23 percent of which was capital gains. The average non-elderly filer had an income of $26,199, 9 percent of which was from capital gains.42
Hence, the high capital gains tax rates punish the elderly, not the rich. The high tax rate is also a severe penalty against couples that have frugally saved during their working years to sustain themselves during retirement.
The “Rich” May Pay More Capital Gains Taxes if Rates Are Lowered.
Paradoxically, if the capital gains tax rate is lowered, the rich may pay more taxes than they do now. The reason is that wealthy Americans have hundreds of billions of dollars outside the reach of the tax collector as a result of the lock-in effect. They are avoiding the tax by holding their assets. The CBO found in 1988 that the share of total capital gains tax collections from the wealthy rises when the tax rate is low, and falls when the rate is high. According to the CBO,
-
“The share of gains realized by upper income groups rose when gains were growing rapidly and declined when gains were stable or falling. For example, the top 1 percent of returns ranked by income accounted for 50 percent of realized long-term gains in 1968 [27 percent top rate], only 33 percent between 1975 and 1978 [49 percent rate], and about 55 percent between 1982 and 1985 [20 percent rate].” 43
The U.S. Chamber of Commerce Office of Tax Policy found that after the 1981 rate reduction, total capital gains taxes paid by Americans with earnings over $500,000 per year rose threefold. Low- and middle-income Americans’ capital gains taxes rose by only slightly more than one-third. After the 1986 capital gains rate increase, the average millionaire reported $1.5 million less capital gains and paid about $250,000 less taxes in 1991 than in 1985. Capital gains realizations fell by two-thirds for those with incomes over $200,000, but they fell by less than 50 percent for those earning less than $50,000. 44 Most of the revenue increases from the 1981 tax rate reduction were the result of the wealthy paying more tax; most of the revenue loss from the 1986 rate hike was due to the wealthy paying less tax.
The conclusion that the rich will receive a giant tax cut if the capital gains tax rate is reduced is predicated on the assumption that behavior will not change in response to the lower tax penalty. But all of the evidence suggests that behavior does change when the rate is reduced: more capital gains are reported. When economists Gerald Auten and Joseph Cordes took into account the behavioral change predicted to result from a capital gains rate reduction to 20 percent, they found that the rich would pay 16.1 percent more capital gains taxes under that scenario than under the current tax rates.45
Table 8
Static versus Dynamic Estimate of Capital Gains Tax Cut
|
Permanent Income Class (1990 dollars)
|
Percent Change in Capital Gains Taxes (%)
|
|
Static Simulation
|
Dynamic Simulation
|
|
| Less than $20,000 |
-34.9
|
-20.7
|
| $20,001-50,000 |
-32.3
|
-29.9
|
| $50,001-100,000 |
-30.3
|
-4.7
|
| $100,001-200,000 |
-30.1
|
-13.8
|
| $200,000 or more |
-25.6
|
+16.1
|
| All Returns |
-28.0
|
+2.2
|
| Source: Gerald E. Auten and Joseph J. Cordes, “Policy Watch: Cutting Capital Gains Taxes,” 1991, Based on “Statistics of Income,” 1979-1983 Panel of Individual Income Tax Returns. a Average adjusted gross income for 1979-83 calculated under 1990 law. |
Is It Fair to Tax Gains Due Solely to Inflation?
One of the least fair features of the capital gains tax is that it taxes gains that may be attributable only to price changes, not real gains. That is because the capital gains tax, unlike most other elements of the U.S. tax code, is not indexed for inflation. The nonpartisan Tax Foundation reports that that can have major distortion effects on what an individual pays in capital gains taxes and can—indeed, often does—lead to circumstances in which investors “pay effective tax rates that substantially exceed 100 percent of their gain.”46
As an example, consider the following hypothetical case. If an investor purchased a $10,000 diversified portfolio of stock in 1970 as a retirement nest egg, and that stock appreciated in value at the same rate as the Dow Jones Industrial Average over the next 20 years, then it could have been sold when the investor retired in 1989 for roughly $28,000. Yet that stock would have had to be sold for about $31,000 to have kept pace with the rate of inflation over that 20-year period. Hence, the investor suffered a real loss in purchasing power of about $3,000 on the stock. Nonetheless, under current law the retiree would have to pay $5,040 in capital “gains” tax (assuming he is in the 28 percent tax bracket) on an investment that produced a real $3,000 capital loss. That means that the investor would pay a 129 percent tax rate on the investment.47
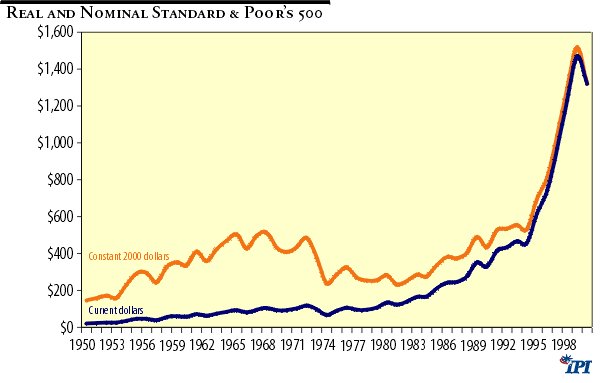
It is not at all uncommon for taxpayers to pay capital gains tax rates that high. Then-Federal Reserve Board governor Wayne Angell calculated in 1993 that the average real tax rate on investments in NASDAQ stocks from 1972 to 1992 had been 68 percent.48 The real tax rate on investments in the Standard & Poor’s Composite Index over the same time period was 101 percent. The average real tax on a portfolio of New York Stock Exchange stocks was 123 percent. And the average real tax on the Dow Jones Industrial Average over that 20-year period was an astounding 233 percent. In other words, according to three of the four indexes, investors paid capital gains taxes on investments that actually lost money after adjusting for inflation—and thus the tax simply diminished the principal. Angell concluded,
-
“If we are to reduce the damaging effects that we know are caused by all capital taxation, it makes sense to eliminate the worst aspect of the most damaging tax on capital—the tax on phantom gains. The tax on real capital gains is a middle-of-the-road bad tax. But the tax on nominal capital gains without regard to whether the gain is real or only the effect of inflation is truly the worst tax.” 49
Even investments that are held for a relatively short period of time, one year, are taxed at a significantly higher effective rate than the statutory 20 percent. Historically, inflation has caused effective rates to be much higher than statutory rates, which is one explanation for the slowdown of the early 1990s, as the chart shows.50
To illustrate this effect another way, look at the nominal and real rise of the stock market over time. As the chart shows, there is a very large gap that represents gains due exclusively to inflation. There is no valid rationale for taxing these “gains.”
Figure 12
Will a Capital Gains Cut Increase Economic Growth?
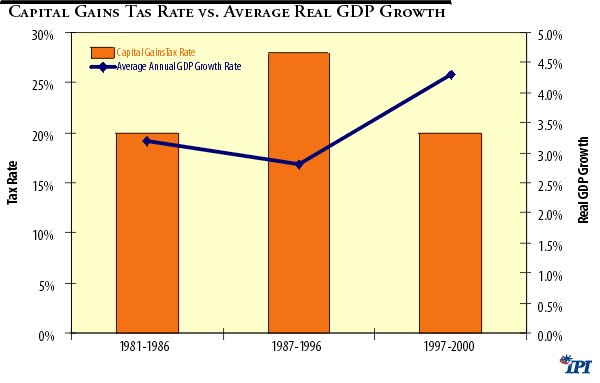
Each of the preceding sections examined particular effects of the capital gains tax on economic activities. Ultimately, however, the most important question is whether the sum of those effects is positive or negative for the United States economy as a whole. The historical evidence, on balance, indicates that there is a strong inverse relationship between capital gains tax rates and overall economic growth. As the chart shows, the real annual GDP growth rate was higher from 1981–1986, when the capital gains rate was 20 percent, than it was from 1987–1996, when it was 28%. Growth again dramatically accelerated following the 1997 cut, although it has recently slowed.51
Figure 13
The effects of increases in growth overwhelm all of the downside concerns about cutting the capital gains tax. Since economic growth drives all of the benefits outlined in this study—job creation, competitiveness, government revenues, spurring small business creation and growth—the benefits of growth cannot be outweighed by any of the isolated harms a capital gains cut could cause. Given the current context, increasing economic growth should be the overriding imperative of US fiscal policy.
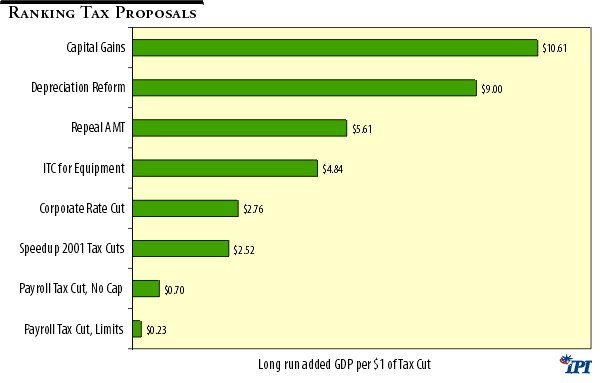
A very recent study by IPI economists Gary and Aldona Robbins provides compelling evidence that any economic stimulus plan should include a capital gains cut. The economists find that a capital gains cut would have the greatest stimulus effect when adjusted for the dollar cost to the Treasury. Incredibly, the IPI study shows that a capital gains cut would grow the economy by more than $10 for every dollar of lost revenue, substantially more than any other stimulus measure.52
Figure 14
Conclusion
This study reviews the historical experience with the economic effects of the capital gains tax. On balance, the evidence supports the case for an immediate capital gains tax cut. The economic evidence—and more important, recent actual experience—suggests that a rate reduction would /increase capital investment, new business formation, jobs, and the rate of growth of GNP. When the positive economic impact of a capital gains tax cut is fully accounted for, the current proposed capital gains tax cut will almost certainly be a revenue raiser over the long term or, at worst, will leave the federal budget unchanged.
Ultimately, the most pro-growth and fairest tax treatment of capital gains would be to abolish the tax entirely (and end the deductibility of interest). To the extent that a zero capital gains tax paradigm promotes economic growth, the policy change would benefit Americans from all income classes, not just the wealthy.
Endnotes
1. Lawrence Kudlow, Private Recession, July 31, 2001. URL: http://www.clubforgrowth.org/articles/010731kud.shtml
2. The Joint Tax Committee defines a taxpayer’s net capital gain for the year as “the excess of the net long-term capital gain over the net short-term capital loss. Gain or loss is treated as long-term if the asset is held for more than one year.”
3. Some types of capital gains are exempt from capital gains taxes. For instance, most home sales are not subject to capital gains taxes when the seller purchases another home. Moreover, pension funds, which purchase stocks and other assets, are exempt from paying taxes on capital gains.
4. Jude Wanniski, Testimony before the Senate Finance Committee, March 15, 1995.
5. Alan S, Blinder, “The Level and Distribution of Economic Well-Being,” in The American Economy in Transition , ed. Martin Feldstein (Chicago: University of Chicago Press, 1980), p. 48.
6. Congressional Budget Office, “Indexing Capital Gains,” August 1990.
7. Victor Canto and Harvey Hirschorn, “In Search of a Free Lunch,” Laffer and Canto Associates, San Diego, November 1994.
8. See, for example, Norman B. Ture and B. Kenneth Sanden, The Effects of Tax Policy on Capital Formation (New York: Financial Executives Research Foundation, 1977); Jude Wanniski, “Capital Gains in a Supply Side Model,” Statement before the Senate Finance Committee, February 15, 1995; and Raymond Keating, “Eliminating Capital Gains Taxes: Lifeblood for an Entrepreneurial Economy,” Small Business Survival Committee, Washington, 1995.
9. Small Business Survival Committee, “Small Business and the Economy,” Washington, January 1995, p. 3.
10. National Venture Capital Association web page: http://www.nvca.org/ffax.html
11. Mark Bloomfield, American Council for Capital Formation, Testimony before the Senate Committee on Finance, February 15, 1995.
12. The General Equilibrium Model of Differential Asset Taxation is a sophisticated simulation computer model of the economy. It incorporates four major capital using sectors: corporations, non-corporate businesses, state and local governments, and 147 separate household sectors. The particular assets held by those sectors are sensitive to the after-tax yields on investments, the riskiness of the assets, and a measure of risk aversion. The model also contains a detailed representation of the major elements of personal and corporate tax laws, thus allowing the researchers to measure how capital is allocated in response to various changes in the tax code—in this case, a reduction in capital gains taxes.
13. Patrick Hendershott, Yunhi Won, and Eric Toder, “Economic Efficiency and the Tax Treatment of Capital Gains,” National Chamber Foundation, Washington, 1990. Emphasis added.
14. American Council for Capital Formation, “Capital Gains Taxation and U.S. Economic Growth,” December 16, 1999, URL: http://www.accf.org/December99test.htm
15. Agence France Presse , “Japan’s ruling LDP to finalize capital gains tax reforms” October 3, 2001.
16. For further information, see David L. Birch, “Who Creates Jobs?” Public Interest 65 (1981).
17. See Clark S. Judge, “The Tax That Ate the Economy,” Wall Street Journal, June 24, 1991, editorial page.
18. The 49 percent rate was the effective top rate in the late 1970s after accounting for all phase outs of deductions.
19. National Venture Capital Association, 1991 Annual Report (Washington: NVCA, 1992). And NVCA web page: http://www.nvca.org/ffax.html
20. See Coopers and Lybrand and Venture Economics, “Third Annual Economic Impact of Venture Capital Study,” conducted for the National Venture Capital Association, 1993.
21. Richard Bernstein, “Small Stock Performance and Investor Risk Perception,” Merrill Lynch, New York, 1990.
22. American Electronics Association, National Venture Capital Association, and Coopers and Lybrand, p. 2.
23. A study by economist James Poterba finds that “a one percent change in the marginal tax rate leads to a one percent change in reported income, so even without any change in the true tax base, capital gains tax cuts would be essentially self-financing.” James M. Poterba, “Tax Evasion and Capital Gains Taxation,” American Economic Review, May 1987.
24. On the effect of the 1969 rate increase, see Gerald Auten, “Empirical Evidence on Capital Gains Taxes and Revenues,” U.S. Department of the Treasury, 1979; and Gary Brannon, “The Lock-in Problem for Capital Gains: An Analysis of the 1970–71 Experience,” in The Effect of Tax Deductibility on the Level of Charitable Contributions and Variations on the Theme (Washington: Fund for Policy Research, 1974).
On the effects of the 1978 and 1981 rate reductions, see Michael R. Darby, Robert Gillingham, and John S. Greenlees, “The Direct Revenue Effects of Capital Gains Taxation: A Reconsideration of the Time-Series Evidence,” Treasury Bulletin, June 1988.
On the 1986 rate hike, see Lawrence B. Lindsey, “Capital Gains Taxes under the Tax Reform Act of 1986: Revenue Estimates under Various Assumptions,” National Bureau of Econometric Research Working Paper no. 2215, April 1987.
On the 1997 rate cut, see Stephen Moore, “Capital Gains Tax Cuts Aren’ ;t Just for the Rich,” Wall Street Journal, July 15, 1999.
25. Joseph J. Minarik, “The New Treasury Capital Gains Study: What Is in the Black Box?” Tax Notes, June 28, 1988.
26. Jane G. Gravelle, “Capital Gains Tax Proposals,” Statement before the Senate Finance Committee, February 15, 1995.
27. Robbins and Robbins, “Putting Capital Back to Work for America”; Sinai; Robert Gillingham, John Greenlees, and Kimberly Zieschang, “New Estimates of Capital Gains Realization Behavior: Evidence from Pooled, Cross Section Data,” Office of Tax Analysis, Department of the Treasury, May 1989; and Michael Darby et al., “The Direct Revenue Effects of Capital Gains Taxation,” Treasury Bulletin (Spring 1988).
28. House Policy Committee, “2000 Annual Report to Taxpayers,” URL: http://policy.house.gov/annreport/2000/charts.html
29. U.S. Congress, Joint Economic Committee, “Capital Crimes: The Impact of the 1986 Capital Gains Tax Hike,” 1993.
30. Congressional Budget Office, “How Capital Gains Tax Rates Affect Revenues: The Historical Evidence,” March 1988.
31. Gary Robbins and Aldona Robbins, “Reducing Capital Gains Tax Rates,” Institute for Policy Innovation Issue Brief, Lewisville, Texas, 1995.
32. Cited in U.S. Congress, Joint Economic Committee, “Capital Crimes: The Impact of the 1986 Capital Gains Tax Hike.”
33. Alan Reynolds, “Time to Cut the Capital Gains Tax,” Supply Side Analytics, Polyconomics Inc., 1989. Emphasis in original.
34. Quoted by American Council for Capital Formation.
35. Internal Revenue Service, Statistics of Income, “Individual Income Tax Returns 1999,” URL: http://ftp.fedworld.gov/pub/irs-soi/99inprel.exe
36. Lucinda Harper, “Treasury, Congress Disagree How Much GOP’s Gains Tax Cut Benefits the Rich,” Wall Street Journal , January 5, 1995, p. 2.
37. Joseph J. Minarik, “Capital Gains,” in How Taxes Affect Economic Behavior, ed. Henry J. Aaron and Joseph A. Pechman (Washington: Brookings Institution, 1981).
38. Mark A. Bloomfield, American Council for Capital Formation, Testimony before the U.S. Senate Finance Committee, March 28, 1990.
39. The share of gains reported by Americans with incomes above $200,000 fell from 39.6 percent to 22 percent when incomes were averaged over the four years 1981–84 rather than just one year. Joel Slemrod, “Who Realizes Capital Gains?” Tax Notes, October 23, 1989, p. 494.
40. Bloomfield, testimony of March 28, 1990.
41. Ibid.
42. John Goodman, Aldona Robbins, and Gary Robbins, “Elderly Taxpayers and the Capital Gains Tax Debate,” National Center for Policy Analysis, Dallas, Texas, 1990.
43. Congressional Budget Office, “How Capital Gains Tax Rates Affect Revenues,” 1988, p. 2.
44. Ed Rubenstein, “Gunning for Gains,” National Review, July 19, 1993, p. 16.
45. Gerald Auten and Joseph Cordes, “Policy Watch: Cutting Capital Gains Taxes,” Journal of Economic Perspectives 5, no. 1 (1991): 25–28.
46. Arthur P. Hall, “Issues in the Indexation of Capital Gains,” Tax Foundation Special Report, April 1995.
47. For a more detailed explanation of how inflation affects the real tax rate on capital gains, see Brian Wesbury and Jeffrey Given, “Capital Gains Tax: Fairness?” in U.S. Congress, Joint Economic Committee, Economic Policy Update, May 1995.
48. Wayne Angell, Governor, Federal Reserve Board, Statement before the Republican members of the Joint Economic Committee, June 22, 1993.
49. Ibid.
50. Raymond J Keating, “Capital Gains Tax Cut is Crucial for the Economy,” ; Small Business Survival Committee, URL: http://www.sbsc.org/Media/PDF/EE24CapitalGains.pdf
51. Ibid.
52. Aldona Robbins and Gary Robbins,“What’s the Most Potent Way to Stimulate the Economy?” Institution for Policy Innovation Issue Brief , October 10, 2001.
About the Authors
Stephen Moore is president of the Club for Growth and a senior fellow at the Cato Institute. Phil Kerpen is a research assistant at the Club for Growth.