Introduction
The telecom landscape has fundamentally changed. New competition has arisen on all sides from new technologies and new providers. Traditional telecom providers are being squeezed by new companies and especially by new technologies that will change forever the way competition has been viewed in the telecom space.
In yet another case of supply creating its own demand, new and novel technologies have quickly become critical business tools. In its August 24, 2001 issue, Business Week Online said of instant messaging, “More than 100 million people now use this form of communication. In less than five years, instant messaging has become the most powerful and widely used real-time communication tool since the telephone.”1 (emphasis added)
While regulators quibble over the number of phone lines and competitive services via “plain old telephone service (POTS);” while telephone giants engage in market share battles over long distance access; and while wireless providers besiege customers with advertisements, alternatives to two-way voice telecommunications are multiplying. Wireless, telephone’s close cousin, is only one among several new competitive applications that deserve close examination. Instant messaging, voice over Internet protocol (VoIP), cable broadband and e-mail are some examples of new technologies poised to sweep aside traditional applications and technologies. Saying it another way Plunkett Research observes, “The convergence of the Internet, cellular phones and PCs, plus growing access options through wireless, fiber optic, satellite and DSL, promise a constantly connected global society.”2 Some trended global numbers dramatically support that assessment.
Table 1 Global Telecommunications Service Indicators
| (Figures in millions) | |||||||
| Service |
1990
|
1995
|
% Growth
90 –’95 |
2000
|
% Growth
95 –’00 |
2002
|
% Growth
00 –’02 |
| Main Telephone Lines |
520
|
690
|
33%
|
950
|
38%
|
1,050
|
11%
|
| Mobile Cellular Subscribers |
11
|
90
|
718%
|
500
|
456%
|
750
|
50%
|
| Personal Computers |
120
|
220
|
67%
|
500
|
127%
|
670
|
34%
|
| Internet Users |
2.6
|
33
|
1,169%
|
300
|
809%
|
450
|
50%
|
| Source: Extracted from Plunkett Research, Ltd., Plunkett’s Telecommunications Industry Almanac 2002, Page 7 | |||||||
Table 2 Cellular, PC and Internet Use as a % of Main Telephone Lines (MTL)
|
1990
|
% MTL
|
1995
|
% MTL
|
2000
|
% MTL
|
2002
|
% MTL
|
|
| Main Telephone Lines (MTL) |
520
|
|
690
|
|
950
|
|
1050
|
|
| Mobile Cellular Subscribers |
11
|
2%
|
90
|
13%
|
500
|
53%
|
750
|
71%
|
| Personal Computers |
120
|
23%
|
220
|
32%
|
500
|
53%
|
670
|
64%
|
| Internet Users |
2.6
|
1%
|
33
|
5%
|
300
|
32%
|
450
|
43%
|
| Source: Extracted from Plunkett Research, Ltd., Plunkett’s Telecommunications Industry Almanac 2002, Page 7 | ||||||||
Another evaluative approach to this same data can be drawn from Table 2. We looked at the yearly global totals of mobile cellular subscribers, personal computers and Internet users as a percentage of main telephone lines (MTL). Since main telephone lines have been the stalwart measurement of global telecommunications penetration for over a century, we wanted to see where these other services ranked in recent years compared to that standard.
In 1990 mobile cellular subscribers and Internet users as percentages of MTL were relatively low at 2% and 1%, respectively. At a higher level of penetration, although still lagging behind MTL, was personal computers at 23%. By 1995 there was modest movement. Mobile cellular subscribers had jumped to 13% against the MTL penetration standard, Internet users had increased to 5%, and personal computers had risen to 32%.
By 2000 the numbers were radically changed. Mobile cellular subscribers had leaped to 53% of the MTL penetration standard, pulling even with personal computers penetration. Internet users had also ballooned to 32% of the MTL penetration standard. These numbers suggest that in 2000, mobile telephone subscribers, personal computers and Internet users weren’t merely competitive with main telephone lines—they were approaching parity.
Using Plunkett’s projected numbers for 2002, the numbers get even closer to parity. Mobile cellular subscribers should hit 71% of the MTL penetration standard, personal computers 64%, and Internet usage 43%. By anyone’s standard, this parity clearly demonstrates the competitive nature of communications globally. Personal computers and the Internet offer the reality of communications alternatives to telephone lines, and this is especially apparent in new software developments like Windows XP which, far beyond being an operating system, is also an impressive communications platform.
Other data likewise shows the growing competitive nature of telecommunications. For instance, the competitive local exchange carriers (CLECs) have made penetration into the strongholds of the incumbent local exchange carriers (ILECs). Data from the Federal Communications Commission (FCC) shows this modest but growing trend of competition.
Table 3 End-User Lines Reported
|
ILEC Lines
|
CLEC Lines
|
Total
|
CLEC Share
|
|
| Dec-1999 |
181,307,695
|
8,194,243
|
189,501,938
|
4.3%
|
| Jun-2000 |
179,761,930
|
11,557,381
|
191,319,311
|
6.0%
|
| Dec-2000 |
177,683,672
|
14,871,409
|
192,555,081
|
7.7%
|
| Jun-2001 |
174,485,706
|
17,274,728
|
191,760,434
|
9.0%
|
| Source: http://www.fcc.gov/Bureaus/Common_Carrier/Reports/FCC-State_Link/IAD/lcom0202.pdf | ||||
In a May 2001 report, the Common Carrier Bureau’s Industry Analysis Division of the FCC reported that, for the period from December 1999 to December 2000, the number of ILEC lines actually declined from over 181 million to 177 million. For the same period CLECs experienced an end line gain from over 8 million to over 16 million—a virtual one-to-one correlation. That equates to a doubling of the CLEC share of the end line business.
CLEC service provided to residences by cable operators seems to be buoyant, and relatively high in revenue. AT&T announced recently that it reached average revenue per user of $55 per month for its cable modem and cable telephony. What’s more, they announced that “telephone service delivered over cable lines would break even in the current quarter, about nine months ahead of its original projection.”5 On its conventional CLEC local telephone service, AT&T also offered a “rate-freeze” to New York customers, a sign of strong competitive effort.6
One of the most compelling indicators of telecom competition is that, until December 1999, ILECs experienced end line growth. Beginning in the period from December 1999 to June of 2000 and continuing to December of 2000 that end line curve had turned downward.
The competitive trends become even more obvious when we look at similar FCC data on high-speed services for Internet access.
Table 4 High-Speed Line Growth, December 1999 to December 2000
|
% Change
|
||||||
| Types of Technology |
Dec-1999
|
Jun-2000
|
Dec-2000
|
June 2001
|
Jun 2000- Dec 2000
|
Dec 2000- Jun 2001
|
| ADSL |
369,792
|
951,583
|
1,977,377
|
2,693,834
|
108%
|
36%
|
| Other Wireline |
609,909
|
764,099
|
1,063,563
|
1,088,066
|
35%
|
7%
|
| Coaxial Cable |
1,414,183
|
2,284,491
|
3,576,378
|
5,184,141
|
57%
|
45%
|
| Fiber |
312,204
|
307,151
|
376,506
|
455,593
|
22%
|
21%
|
| Satellite & Fixed Wireless |
50,404
|
65,615
|
112,405
|
194,707
|
71%
|
73%
|
| Total Lines |
2,756,492
|
4,372,939
|
7,106,229
|
9,616,341
|
62%
|
36%
|
| Source: High-Speed Services for Internet Access: Subscribership as of December 31, 2000, Industry Analysis Division, Common Carrier Bureau, Federal Communications commission, August 2001 | ||||||
In their February 2002 report (reporting figures as of June 30, 2001) the FCC noted broadband subscribership had increased to 9.6 million.7 In their August 2001 report the Common Carrier Bureau’s Industry Analysis Division of the FCC reported that, for the period from December 1999 to December 2000, total high-speed line growth increased by 158%. In February, broadband Internet use exceeded dialup Internet use (by hours).8 Of course broadband is often considered “always on” because there is no need to continually re-establish the connection: therefore, the Internet connection does not intrude on the use of either cable TV or telephone service.
DSL versus Cable Modem
The most recent data shows cable modem broadband maintaining its lead over DSL both in total number of lines and in percentage increase.
Table 5 High-Speed Lines by Type of Technology
| Types of Technology |
RBOC Lines
|
Other ILEC Lines
|
Non-ILEC Lines
|
Total Lines
|
| ADSL |
1,707,360
|
107,792
|
162,225
|
1,977,377
|
| Other Wireline |
652,369
|
198,276
|
212,918
|
1,063,563
|
| Coaxial Cable |
*
|
*
|
3,540,685
|
3,540,685
|
| Other |
*
|
*
|
444,671
|
444,671
|
| Total Lines |
2,359,729
|
306,068
|
4,360,499
|
7,026,296
|
| *Data withheld to maintain firm confidentiality. Source: High-Speed Services for Internet Access: Subscribership as of December 31, 2000, Industry Analysis Division, Common Carrier Bureau, Federal Communications commission, August 2001 |
||||
Table 6 High-Speed Lines by Type of Technology
| Types of Technology |
RBOC Lines
|
Other ILEC Lines
|
Non-ILEC Lines
|
| ADSL |
86%
|
5%
|
8%
|
| Other Wireline |
61%
|
19%
|
20%
|
| Coaxial Cable |
*
|
*
|
100%
|
| Other |
*
|
*
|
100%
|
| Total Lines |
34%
|
4%
|
62%
|
| *Data withheld to maintain firm confidentiality. Source: High-Speed Services for Internet Access: Subscribership as of December 31, 2000, Industry Analysis Division, Common Carrier Bureau, Federal Communications commission, August 2001 |
|||
Table 7 Internet Connection Options
|
Speed
|
Times Dial-up Speed
|
||
| Conventional Dial-up |
0.056 Mbps
|
—
|
|
| ISDN Phone Line |
0.112 Mbps
|
1.00
|
|
| DSL Phone Line |
0.800 Mbps
|
13.29
|
|
| Cable TV Modem |
1.000 Mbps
|
16.86
|
|
| Source: Extracted from Plunkett Research, Ltd., Plunkett’s Telecommunications Industry Almanac 2002, Page 10 |
|||
Table 8 Average Time Required to Download
|
Dialup
|
ISDN
|
Satellite
|
DSL
|
Cable
|
|
| An Email (5 Kilobytes) |
1 sec.
|
< 1 sec.
|
< 1 sec.
|
< 1 sec.
|
< 1 sec.
|
| A Basic Web Page (25 Kilobytes) |
10 sec.
|
5 sec.
|
< 1 sec.
|
< 1 sec.
|
< 1 sec.
|
| A Complex Web Page (500 Kilobytes) |
90 sec.
|
40 sec.
|
15 sec.
|
7 sec.
|
4 sec.
|
| One Five Minute Song (5 Megabytes) |
15 min.
|
8 min.
|
2 min.
|
1 min.
|
40 sec.
|
| One Movie Preview (30 Megabytes) |
80 min.
|
40 min.
|
15 min.
|
7 min.
|
4 min.
|
| On Two Hour Movie (500 Megabytes) |
20 hrs.
|
10 hrs.
|
4 hrs.
|
2 hrs.
|
70 min.
|
| Source: Broadband 101–Telecom Corporation 2001 | |||||
Now rate those times against the comparable times it would take to download on a traditional dial-up connection, and the difference between the choices becomes obvious. The question to the consumer then becomes traditional dial-up versus the faster alternatives. Does the consumer migrate from DSL to cable? An equally significant question is whether to migrate from traditional dial-up to either DSL or cable. True, there are still availability questions. And yes there are local telephone service implications, but the competitive edge becomes apparent when you look at the numbers above.
Research in customer choice and satisfaction is yielding some interesting results. For example, survey research by The Strategis Group suggests that while customers who have a choice between DSL and cable seem to be more inclined to choose DSL (60%), there appears to be greater customer satisfaction with cable.9
The defining factors in customer satisfaction are overall quality, access speed and “always on” connectivity. Keith Kennebeck, the survey analyst for Strategis Group, attributes consumer preference for DSL purely to superior marketing strategies. He suggests that, quite simply, more people know about DSL and are making their decision based on more visible marketing penetration. As we noted before, most people are making the decision between dial-up and broadband. The selection of DSL over cable is more a selection of DSL over dial-up.
To that point, the study found that cable companies are experiencing a lower “churn rate,” or service drop-off. That factor is likely more directly tied to customer satisfaction issues. So we may infer a few things: 1) that the initial selection for Internet access is between dial-up and broadband; 2) that marketing saturation for DSL is leading consumers to initially select DSL; and 3) that satisfaction recognition for cable modem then migrates people from DSL to cable. The study found that the churn rate for DSL is 15%, while it is only 8% for cable modem.
The cable modem industry enjoyed an advantage in initial broadband deployment because of cable’s ease of installation. Some DSL installation was hindered by line qualification problems. These delayed installation in many cases and actually prevented installation in others.
Furthermore, while comparing cable and DSL technologies, we should point out that the two technologies are regulated very differently, giving cable a distinct regulatory advantage. Almost certainly the regulatory advantage has contributed to higher availability and a faster rollout of cable broadband services.
There are those who suggest that both DSL and cable modem are interim technologies which will ultimately give way to more sophisticated broadband options. IDG.net Infocenter suggests that, “Fiber-optic technology could be the [alternative to both], offering super-high-speed Internet access and easily variable bandwidth at a fraction of the cost of service on traditional copper lines. Once affordable and attainable only by large enterprises, fiber-optic technology is beginning to attract small businesses and even a handful of residential consumers.”10
IDG found several small businesses that are now using fiber as an alternative to other broadband offerings. InSors, a small Illinois videoconferencing company, has its fiber service with network speeds of 100 Mbps. By comparison, a T1 line with just 1.5 Mbps of bandwidth can cost $600 to $1,500 a month. Upgrading a T1 to a fractional T3 can take a month, with the resulting 3 Mbps service costing $2,000 a month or more.11
The other aspect of fiber that intrigues some corporations is its ability to increase bandwidth quickly. NxTier Technologies, a logistics management firm for the trucking industry in Worcester, Massachusetts, gets fast 10 Mbps access for $4,000 a month. But perhaps more importantly, NxTier can up its bandwidth tenfold on 3 hours’ notice without having to pay its provider for additional line installations. In other words, their network can grow as fast as they need it.
Often forgotten but nonetheless significant is the fiscal aspect of the broadband issue. Figure 1 shows the trend in broadband pricing from 1996 to 2000 and estimated pricing through 2002.
Figure 1
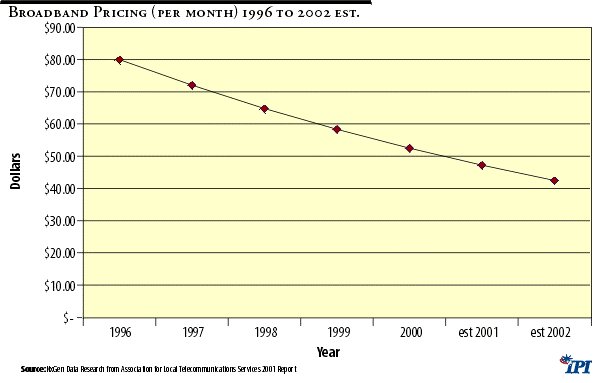
Residential pricing in broadband services has continuously dropped over the past several years and is expected to follow its downward slope in the foreseeable future. The 1996 average price for residential broadband according to NxGen Data Research stood at $80.00 (see Figure 1), which tumbled to an average price of $52.50 in 2000. It is estimated that by the end of 2002 it will come down to $42.50.
Voice Over Internet Protocol (VoIP)
The area of broadband deployment and alternative service offerings is not limited just to Internet access opportunities. The fact is CLECs have also been experimenting with other new competitive opportunities designed to create their footprint. For example voice over Internet protocol (VoIP) has been quietly gaining momentum. As reported in Boardwatch on August 1, 2001, the Phillips Group-Infotech indicated, “17 percent of U.S. businesses began the implementation of IP LAN telephony in the year 2000.” While this may not seem immediately significant, it is over 30 percent more than was previously projected.12 Another estimate says IP services “including voice conferencing, video conferencing and instant messaging” are expected to generate $28 billion in revenues by 2007.13 And Frost & Sullivan expects worldwide VoIP service revenue to grow from $2.2 billion in 2001 to $158.6 billion over the next five years (Table 9).
Table 9 VoIP Services Market: Retail VoIP Services Revenue Forecast (World), 2000–2007
| Year |
Revenue
($Million) |
Revenue Growth Rate
(%) |
|
| 2000 |
1,391.70
|
—
|
|
| 2001 |
2,222.06
|
59.97
|
|
| 2002 |
4,008.21
|
80.38
|
|
| 2003 |
7,973.47
|
98.93
|
|
| 2004 |
19,037.21
|
138.76
|
|
| 2005 |
43,134.53
|
126.58
|
|
| 2006 |
94,334.41
|
118.7
|
|
| 2007 |
158,555.02
|
68.08
|
|
| Compound Annual Growth Rate (2000–2007): |
|
96.7%
|
|
| Note: All figures are rounded; the base year is 2001. Source: Frost & Sullivan |
|||
While still evolving corporations, Internet service providers (ISPs) and CLECs should recognize the critically important role that VoIP technology will play in the near future. There are significant reasons to deploy VoIP. Savings accrue using IP instead of conventional long distance service. For personal use, a number of free services are available and teleworkers can save the company money, especially with overseas calls. IP systems can reduce operating expenses by offering lower costs for maintenance, facilities, upgrades and equipment.
VoIP deployment includes many other benefits: a wealth of features, functions and capabilities not found in traditional PBX systems; a greater level of personalized service while a call is in progress; an increase in collaborative efforts among teams of workers; reduction in staffing requirements and costs since only one operator per enterprise is required (versus one operator per site); quick and easy deployment of systems anywhere your data network reaches; and reduction of redundant equipment.15
Christopher Mines of Forrester Research agrees with the previously stated Boardwatch assessment. Many of the former dominant voice carriers appear to be fleeing their traditional haunts while new voice technologies and services, sparked by the ever-increasing ubiquity and reliability of IP networks, are about to catch fire.
While at the present time VoIP services are a small segment of the huge markets they are aiming for, their growth is picking up precipitously. Mines suggests that VoIP “ . . . is a classic disruptive technology: a low-price, low-quality substitute for traditional service.” During 2000, Forrester Research found that 17% of 16–22 year olds were using voice over Internet calls, and an even higher percentage of 13–15 year olds were doing so. 16 An astounding 15% of online consumers now use their PCs for calls. Services like Dialpad.com and Net2Phone are especially popular with lower-income young consumers. The service has both convenience and financial appeal. VoIP can be used on the same Internet connection you are using to view a catalog or a document that you are discussing with another party. Pricing is also a treat—long distance VoIP prices run between zero per minute and about five cents—depending on the voice quality the VoIP carrier supports, whether the called party is also using VoIP, and whether the called party is o n the same VoIP network. In contrast, regular analog long distance can cost between 5 cents and 25 cents per minute for residential users, and about 1 to 3 cents for extremely high volume corporate customers. And wholesalers like ITXC will drive 30-fold growth in international VoIP minutes between 1998 and 2001, reaching 4% of the total long distance market.17
Mines contends that ever-smarter voice-recognition software allows people to access Web based applications and information by phone, citing American Airlines, Charles Schwab & Co., and AOL by Phone as examples of companies successfully using voice-recognition software for Internet access. This allows people to talk and listen to information from the Web. By the same token bigger organizations like Lucent, IBM, Motorola, and Sprint are supporting the Voice XML standard, which will voice-enable enterprise applications like Siebel Systems and PeopleSoft.
Significantly, these technologies are not only available to large corporations—they are available to small businesses and even consumers through Microsoft’s Windows XP—a surprisingly sophisticated communications platform now widely available and easily affordable. IP telephony is built right into the XP platform, so the consumer or small business that adopts Windows XP gains three different competitive communications technologies—IP telephony, e-mail, and instant messaging.
There is also a benefit to the management of communications using the Web. For example, moving voice from circuit to packet networks will also enable a new generation of communications management applications. This kind of technology will allow businesses to use PCs to set up conference calls and access such things as unified e-mail and voice-mail.
So telecommunications carriers need to prepare for the change as these new voice services mature, combining the visual interface and open applications of the Web with the ubiquity and intimacy of voice telephone. There will be a re-acceleration of voice services growth, creating vast new growth opportunities for telecom service providers who are prepared to nurture the new medium.18
E-mail is the most mature of the trio (E-mail, VoIP and IM) of new applications that compete directly with conventional voice services. E-mail is used both as a voice call substitute and a postal mail substitute, since it shares attributes with both.
Particularly for businesses, e-mail is an important communications tool that occupies a significant part of the day. “Business users spend an average of 49 minutes every day managing their e-mail, and receive an average of 22 e-mail messages every day…53 percent of those polled checked their e-mail at least six times a day when they were in the office, while 34 percent admitted to checking it constantly.”19
E-mail, like voice telephone service, is part way along the continuum between face-to-face discussion and conventional published material. And e-mail is better that face-to-face for some contexts. “E-mail, Short Message Service (SMS) and other electronic forms of communicating all lack the nuances of emotion that characterize most other forms of communication…. The telephone does allow some contextual communication, such as a person’s tone of voice, which puts it between face-to-face and e-mail… [Ned Kock, director of the E-Collaboration Research Center at Temple’s Fox School of Business and Management] said most of the participants perceived that they performed the task better by e-mail… participants consistently cited two explanations for this feeling. “People felt that the individual contributions by the group members were better constructed…the second explanation given was, because e-mail is asynchronous, the group could interact at different times, …”20
E-mail among in-house business work groups is often delivered so quickly that back and forth conversations can occur over a few minute period—almost like IM, or a quick succession of voice-mails. E-mail also makes it easy to copy others on these conversations—even if they are not participating in real time, which may explain why 34% of e-mail users check for new mail constantly.
On the home front, e-mail usage continues rising as a way to keep in touch with family. The Pew Internet Study reported, “Internet users also said they are e-mailing family members more, with 84% of respondents using the technology to keep in touch with relatives.”21 According to the Yankee Group, 93% of households primarily access e-mail services.22 The added e-mail use is probably both a substitute for phone calls and a supplement to family communications. E-mail traffic with family members increased despite a slight decline in overall time spent in Internet sessions: “Users did moderate their time online somewhat in 2001, the study found. The average online session fell to 83 minutes from 90 minutes in 2000, as some find the Internet less appealing and others said they have less time to browse.”23
Instant Messaging
According to The Wall Street Journal, corporate America is discovering the power of instant messaging (IM).24 Over the past few years, tech-savvy workers have quietly brought IM into the work place. They have found that IM allows them to collaborate more efficiently with colleagues. Like e-mail before it, IM has the potential to reshape how workers communicate and share knowledge.
As recently as August 1999, the instant messaging debate centered on the inability of different carriers to enable their customers to instant message with each other. But even when discussing this problem, observers were beginning to realize that the IM phenomenon had the capability of being a telecommunications replacement service. In an August 1999 article in The Seattle Times, Corporate Computer CEO Walter Taucher compared IM to CB radios. “It’ s like an online teletype,” he said.
The instant message may be the first real communications hybrid. IM is text-based and it travels over communications lines. But like a telephone, it provides instant response capability. There is little space for message retention (you’d have to copy it to a file to save it) but that is what makes it more-telephone like. It is instant and instantly interactive. There usually is no need or desire to retain the “conversations,” no more than people try to keep a copy of voice conversations.
One of the downsides that have been suggested is the concern about whether employees are losing productivity by spending too much company time in “ chat room” conversations made possible by IM technology. The fact is that there doesn’t seem to be any more evidence of time wasting in instant messaging than there is in personal telephone usage. And the up side is enhanced instant communications within organizations.
There is now data that seems to bear this out. In research regarding personal use of IM, Insight Express found that instant messaging was not being viewed as a work distraction but rather as a new business and professional tool. Although a small sample of only 300 respondents was used, the data is instructive.
As noted in Table 10, almost half (47%) of respondents said that they use IM. That percentage aligns closely with Forrester’s findings for the youth market of 48%.25 A more recent survey from the Yankee Group puts household use of IM at 53%. 26 That alone is significant. But of more interest is that while 96% of those who use IM use it at home, the number of those who uses it at the office is up to 20%. Furthermore, of those who are using it professionally, 39% say they believe it improves productivity. Dramatically, about half (49%) of professional users say that IM replaces the telephone!
Table 10 Instant Messaging Usage Distribution
| Consumers who use instant messaging | 47% |
| Use instant messaging at home | 96% |
| Use instant messaging at work | 20% |
| Improves work productivity | 39% |
| Replaces telephone | 49% |
| Source: Extrapolated from Insight Express Report, August 2, 2001, express.com | |
Table 11 Instant Messaging Preferences
| Seeing a friend or “buddy” on line | 82% |
| Seeing when a “buddy” is no longer on line | 70% |
| Instant messaging as a telephone replacement | 49% |
| Block unknown participants or messengers | 42% |
| Instant messaging as an email replacement | 35% |
| Source: Extrapolated from Insight Express Report, August 2, 2001, express.com | |
Like other competitive services, IM is a telephone replacement for almost half of survey respondents. Furthermore, the fact that unknown participants or messengers can be blocked is cited by 42% as a benefit of the service. Lastly, IM has the benefit of being an e-mail replacement for 35% of the respondents.
Noting the small sample, the Gartner Group questioned whether this was a valid enough indicator to promote business use of instant messaging. Gartner also suggested that the security risks should send a caution to businesses beginning to engage the practice. The risk is that instant messages can be altered or high jacked. The Gartner concerns may be valid, and massive conversion or utilization of IM by businesses may not be likely at present. But other data seems to confirm the popularity of IM.27
The Yankee Group’s Interactive Consumer Survey 2001 polled a group ten times the size of the Insight Group to test instant messaging’s popularity. Yankee Group found that the instant message penetration into households is at 71%. The study found that more women use it than men and that while younger people are more inclined to use instant messaging, nevertheless the 55–64 age group has a 62% penetration. As technology and Internet usage expand, the differentiation between age groups tends to flatten.
Figure 2
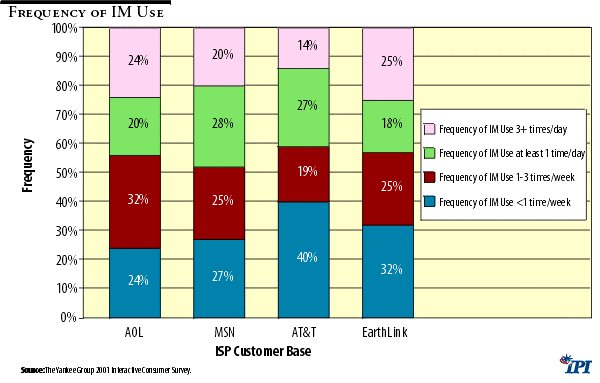
Insight and Yankee both found relatively close results in terms of which Internet service providers (ISPs) were the most popular (see Table 12). AOL still maintains a commanding lead in ISP presence, but both MSN and Yahoo have made strides in penetrating the market. Yet to be seen is how the already-mentioned Microsoft service, Windows Messenger (packaged in its XP operating system), will fair as that it gains penetration into the market place.
Table 12 Instant Messaging Service Provider Usage
|
Yankee Group
|
Insight
|
|
| AOL |
57%
|
56%
|
| MSN |
37%
|
47%
|
| Yahoo |
31%
|
32%
|
| ICQ |
20%
|
14%
|
| Prodigy |
1%
|
|
| Other |
7%
|
6%
|
What may be of more importance than the existing instant messaging penetration are the advances in IM that are coming on line. It is only a matter of time before advances in media-rich technology such as videoconferencing and file sharing will be as available as IM features. When videoconferencing becomes available it will change the dynamic of the business community’s approach to many of the concerns that Gartner suggests.
But mail order business retailing seems to have already decided that instant messaging can be a vital tool in customer satisfaction. Some retailers are employing the service to help prevent long hold times on phone orders. More and more, companies are employing instant messaging buttons on their Web sites enabling customers to interact immediately with customer service representatives. Perhaps one of the most interesting instant messaging uses is in higher education. The value of instant messaging in distance learning is just now beginning to establish itself.28
In all cases what we find is the potential to use instant messaging as an alternative to two-way voice phone service. The fact that one half of people recognize this potential is significant in itself.
In the meantime businesses have begun to employ policies and technologies that enable them to infuse IM into their communications environment as a productivity tool. On the policy side they are establishing when employees can use IM and what types of IM are appropriate on the job. Many suggest that these policies aren’t much different from the 100-year-old policies about personal phone calls on company time.
On the technology side some behind-the-firewall IM applications are being installed. In many businesses the firewall is being configured to deny access to unauthorized free IM services. Further, delineation is being made between IM within the confines of the organization and outside the parameters of clients, customers or vendors.
IM is not just a stand-alone service. Newer uses combining it with wireless technology have only recently appeared and already seem to be attracting consumer interest. Some DSL lines link a free Internet telephony feature.
As a further example of how these new technologies will converge, Sprint PCS has recently announced that it intends to deploy an intercarrier text messaging service, which would allow its customers to send text messages to other wireless carriers’ customers (Sprint’s customers can currently send text messages only to other Sprint PCS customers).29
Wireless
Perhaps the most visible competitive communications service is wireless. Cellular phones are ubiquitous. The data demonstrates that the growth of this service has been nothing short of explosive.
Table 13 Estimated Total Wireless Subscribers
| Year |
Total Subscribers
|
Service Revenues
(In $000s) |
| 1985 |
203,600
|
$ 354,316
|
| 1990 |
4,368,686
|
$ 4,060,494
|
| 1995 |
28,154,415
|
$ 16,460,516
|
| 2000 |
97,035,925
|
$ 45,295,550
|
| 2001 |
118,397,734
|
$ 58,726,376
|
| Source: Extrapolated from CTIA’s semi-annual wireless service survey http://www.wow-com.com/statsurv/reports/ | ||
The revenue figures as reflected in Table 13 are equally dramatic. They have not jumped by the same levels as subscribership. That is understandable since increased subscribership has enabled a reduction in prices. Furthermore, capital investments, like the improvement and expansion of cell sites, have helped reduce prices. Nevertheless revenue still is increasing powerfully to almost $59 billion in 2001.31
Table 14 Average Local Monthly Bill/Average Local Call Length
| Year |
Ave. Local Monthly Bill
|
Ave. Local Call Length
|
| 1985 |
NA
|
NA
|
| 1990 |
$83.94
|
2.32
|
| 1995 |
$52.45
|
2.27
|
| 2000 |
$45.15
|
2.48
|
| 2001 |
$45.56
|
2.62
|
| Source: Extrapolated from CTIA’s semi-annual wireless service survey http://www.wow-com.com/statsurv/reports/ | ||
The average local call length also demonstrates some interesting competitive data. The increase in the average call length for the five-year period from 1995 to 2000 was only 9%. Yet in just one year, from 2000 to 2001, the average call length increased 6%. Wireless customers are spending more and more time on their cellular phones because calling plans are enabling increased usage. Also, amenities such as free long distance and no roaming charges are encouraging people to lengthen their long distance calls and increase their frequency. As the total price becomes more and more competitive, some customers are finding it more economical to make all their calls on a cell phone.
Plunkett Research reported that cellular phone penetration could reach 80% in the United States by 2005. Combine that with increased general service revenues and a declining price, and some other factors become clear. Plunkett cites research conducted by Peter D. Hart Associates, Inc., which found that 38% of American consumers have some interest in replacing their home phones with wireless phones. We are not talking here about second phone line replacement but actual service replacement.32
Selection of wireless as their primary telecommunications service is fast becoming the home telephone service of choice in many third world countries. The less extensive infrastructure requirements for cellular are far more appealing in countries where wire-line facilities are unavailable or under-available. It is much quicker and much easier to install cellular services than to develop a traditional local exchange infrastructure.
What becomes interesting for consumers and for developers in this new era of competitive services is whether growing areas will turn to wireless type services for new residential or businesses developments. Lehman Brothers sees erosion in wireline revenues as partly explained by wireless substitution: “Revenue declines continue to reflect a fall-off in volumes as consumers substitute e-mail and wireless products for traditional wireline service.”33 Morgan Stanley notes the same residential substitution effects, “We believe the major driver of the decline will be the residential market, where substitution to wireless and other technologies is having a major impact on the industry. At AT&T, for example, average minutes of wireline use per subscriber are currently declining at a rate of 10% year-over-year.”34 Bluntly summing up, Morgan Stanley concludes, “Across the board, residential access lines declined. We believe this is due to substitution to wireless and [broadband] …”35 Jeffries & Company offers a more holistic view of competitive shifts resulting from substitutions, “We attribute the deceleration in this key demand statistic to five factors: (1) general economic weakness; (2) growth in wireline-based competitors–i.e., CLECs in business and cable telephony in residential; (3) the migration of business customers from switched to private lines; (4) wireless phones serving as an alternative for residential voice; and (5) DSL and cable modem connections eliminating the need for dial-up phone lines.”36
Clearly the number of competitive carriers offering business services has exploded in the past few years. The CLEC figures we have cited in this paper point to that.
For example, a Dallas suburb recently developed a system that enabled Valley Ranch Development to offer wireless phone for home use that will steal away market share from land lines.37 AT&T’s Valley Ranch wireless offering bundles with ultra-fast Internet hookup for home PCs at a price that saves consumers about 15% over competing firms. If that project proves successful the CLEC in the area will likely expand the project to other developments.
Another example of the wireless incursion into wire-line based services is the Code-Division Multiple Access (CDMA) technology. This Qualcomm invention enables wireless to greatly expand the number of cellular customers it can handle simultaneously. As Plunkett Research evaluated, “The spread spectrum of CDMA provides the largest coverage in the industry, and the low power necessary for the handsets equals longer battery life and therefore smaller batteries and handsets.”38
Worldwide, systems similar to CDMA are expanding in their availability. Europeans have a variety of extended wireless service alternatives to choose from. As mergers combine the different technologies, the probability of a worldwide wireless system increases.
The forecast for continued expansion of the wireless industry and increasing direct competition with wire-line telephony is strong. Whether due to aggressive marketing and powerful advertising or expanding networks and new technology, the wireless industry has seen remarkable increases in market share and reduction in price. There are at the present time 1,500 cellular systems in the U.S. in 750 markets. PCS systems, which are mostly digital and use a broader bandwidth, have been growing and likely will continue to expand although cellular will likely retain its predominance in the near future.
Wireless will become even more competitive with wire-line as certain issues become resolved in the near term. Wireless providers are engaged in several battles: struggling with calling party pays pricing; trying to guarantee number portability; increasing their prepaid services options; moving into increased digitalization; contending with fraud prevention problems; looking at further industry consolidation; and moving towards multimedia services. But they are in a competitive position with wire-line and will continue to gain ground in the market.
New Competitors
Large companies from industries once considered unrelated to telecommunications now have competitive strategies to break into the telecom market. Both Microsoft and AOLTimeWarner now have aggressive strategies for entering the voice arena. We have already mentioned that Microsoft’s latest operating system—Windows XP—is an impressive communications platform, with VoIP technology built-in. In addition, AOLTimeWarner is already a player in communications with its AOL By Phone and AOL Instant Messaging products. Interestingly, Microsoft has opened its Passport services up to users of AOL. 39 The entrance of these and other companies into the telecom market is yet another indication of the vitality and increasing competition that challenges traditional providers.
Telepresence
When discussing these new communications technologies, it is hard to resist a brief peek into the future of what will be available when these technologies merge and even higher bandwidth is available to the majority of homes and businesses. While too small a factor for today’s regulatory consideration, telepresence (sometimes called virtual reality) is the ability to view anything almost anywhere in the world and to remotely control a camera over the Internet using nothing more than a standard Web browser.
The opportunities for use of this technology is virtually unlimited, from telemedicine to monitoring construction sites. In medicine, telepresence could be highly useful in surgery. As SRI International, Inc. described in a 2002 paper, by combining the proper technologies it could create a new method of surgery—telepresence surgery—that maintains the patient benefits of minimally invasive surgery (MIS) without compromising the surgeon’s skills.40 Telepresence is also being experimented with for monitoring hazardous materials rooms, dangerous chemical sites, and even weather developments. 41
Telepresence may in the next few years resemble in its penetration into the marketplace the same penetration levels that have been experienced by other competitive services previously discussed.
Implications for Public Policy
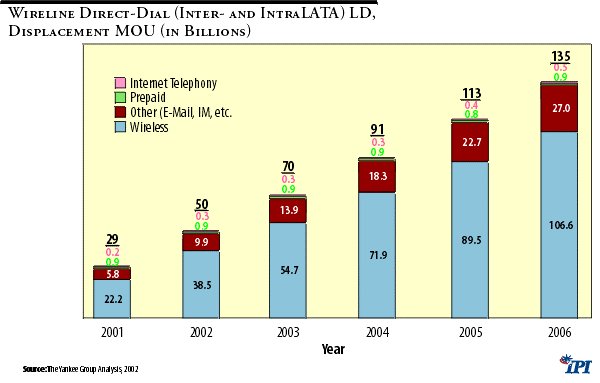
The clear implication is that new communications technologies provide an alternative to traditional voice services, both local and long-distance. The fact that these new technologies are growing rapidly and are substituting for conventional voice calls suggests that the traditional method of measuring “competition in voice services” should be expanded to include these new services. Wireline carriers are losing in both number of lines and number of minutes to these new technologies. In March of this year, the Yankee Group predicted that between 2002 and 2003, wireline carriers would lose 15 billion consumer long distance minutes, and that residential long distance minutes would decline by about 10% per year for the next five years. The Yankee Group concluded that the biggest threats to wireline long distance come from wireless and e-mail/instant messaging.42
Figure 3
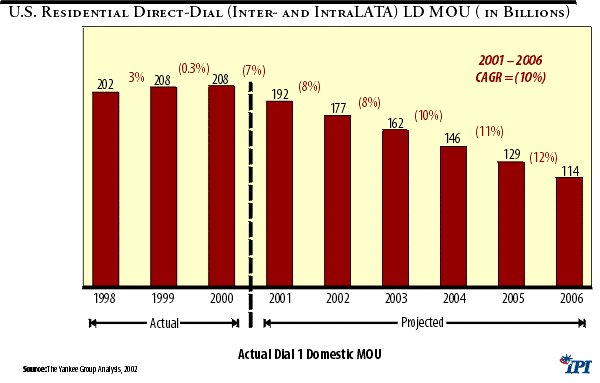
According to The Wall Street Journal, AT&T Chairman C. Michael Armstrong recently told stock analysts that factors such as “the substitution of wireless and e-mail for traditional phone calls…are continuing to hurt revenue.”43 These new technologies represent new forms of competition for traditional providers of both local and long-distance services. It is clear that technology itself is providing enough new competition to make the telecom industry vital and competitive.
Figure 4
Conclusion
By now policy makers are familiar with the pattern of technologies developing faster than government regulations can keep pace. Perhaps the latest and greatest example is the Telecom Act of 1996, which failed to anticipate the direction of telecom development. One key unanticipated change was the degree to which new communications technologies have become major competition for traditional phone services.
As illustrated in this report, the traditional telephone voice service marketplace is facing competition from innovations. Voice over IP, e-mail, instant messaging, and wireless mobile are far beyond the early introductory stage and have become services in widespread use—and largely as substitutes for traditional voice telephony.
In the few years since the Telecom Act of 1996, it has become clear that the amount of regulation clearly affects the rate of rollout and adoption. Furthermore, given the consumer response to technologies and new applications that competed more directly than regulators acknowledge, it is apparent that concerns about sufficient competition in communications were unwarranted. Despite the notable failure of several new communications companies and the overall slump in the technology sector, competition in communications is alive, well, and growing. As policy makers consider pending and future telecom legislation, they would do well to throw out their old ideas about measuring competition, and consider the strong acceptance by consumers of new and expanding forms of communication made available by the digital revolution. In the late 1970s and early 1980s the Federal Communications Commission opened a docket called AMPS, or advanced mobile phone service. At that time, wireless service consisted of radiophones with limited range and limited availability. In just 20 years, wireless service has taken its limited ancestor into more homes today than wire-line was in those days.
By the same token when the U.S. Justice Department filed antitrust suits in 1974 against IBM (“the” computer company) and AT&T (“ the” phone company), the separation between computer technology and telephone technology was considered wide. In the ensuing decades the two technologies have become intertwined in a way that no one would have expected at that time.
At that time AT&T offered to literally buy up their telecommunications competition, which in those days consisted of some minor equipment suppliers and some upstart long distance companies. Now the competition to the successors of the old Bell System is almost dwarfed by the aggregate competition. Perhaps more importantly, the competition is in direct rivalry with those same former telecom giants.
The new competitive media of instant messaging, voice over Internet protocol (VoIP), cable broadband, and telepresence suggest that the technological advance of new interactive communications media is now, is big and is sweeping aside traditional technologies. Together with cellular and PCS wireless services, the new environment today is heavy with competitive offerings. If the experience of the past five to ten years is instructive, it tells us that technology and its deployment will continue to grow by almost geometric proportions—and the competition will expand even more aggressively.
Endnotes
1. As reported by Beau Sharborough, “RootsWorks: Instant Messaging” Ancestry Daily News, October 18, 2000.
2. Plunkett Research, Ltd., Plunkett’s Telecommunications Industry Almanac 2002, Page 6.
3. Ibid.
4. Forrester Research, “Consumer Technology Data Overview” Q4 2000.
5. “AT&T Cable Telephony to Break Even Ahead of Plan,” Reuters March 4, 2002.
6. AT&T offer freezes prices for local calling plan, TRInsight March 5, 2002.
7. http://www.fcc.gov/Bureaus/Common_Carrier/News_Releases/2002/nrcc0201.html.
8. “Broadband usage outpaces dial-up for the first time,” TRInsight, 3/5/02, “Nielsen/NetRatings has reported that during January, broadband Internet usage outpaced dial-up usage for the first time in the history of the Internet. During January, broadband users spent 1.19 billion hours online; this figure accounts for 51% of the 2.3 billion total hours of online use and also represents a 64% increase from January 2001 broadband hours logged.”
9. Pastore, Michael, "DSL Making Gains in Consumer Broadband", February 2, 2001.
10. "Broadband: Beyond DSL and Cable", IDG.net Infocenter August 7, 2001.
11. Ibid.
12. “VoIP–The Quiet Revolution” Boardwatch, August 1, 2001.
13. IP services to generate $28B through 2007, TRInsight March 4, 2002.
14. “VoIP - The Quiet Revolution," Ibid.
15. Ibid.
16. Forrester Research, “Young Consumers Data Overview: Consumer Technographics North America” 1Q2001.
17. “Reinventing Voice” Forrester Research by Christopher Mines, March 16, 2001.
18. Ibid.
19. Gartner Group: "Business people obsessed with e-mail" Reported in NUA Internet Surveys July 4, 2001.
20. "Good E-Mail Communication Requires Hard Work" - Study By Michael Bartlett, Newsbytes, Philadelphia, Pennsylvania, U.S.A., July 31, 2001.
21. Serious Net Use Is on the Rise, Bloomberg News, March 4, 2002.
22. The Yankee Group 2001 Interactive Consumer Survey.
23. Ibid.
24. “Time 4U to Grow Up,” Wall Street Journal, February 25, 2002, p. B1.
25. Forrester Research, “Young Consumers Data Overview: Consumer Technographics North America” 1Q2001.
26. Yankee Group 2001 Interactive Consumer Survey.
27. Boulton, Clint, Should There Be Fear and Loathing of Instant Messaging?, Internet News–Developer News, August 10, 2001.
28. Goldsborough, Reid “Instant Messaging Becomes Big Business,” Philadelphia News, February 19, 2001.
29. “Sprint PCS to deploy intercarrier text messaging,” TRInsight, March 15, 2002.
30. Ibid.
31. Ibid.
32. Plunkett Research, Ltd., Plunkett’s Telecommunications Industry Almanac 2002, Page 14.
33. Lehman Brothers “Equity Research–AT&T,” October 24, 2001.
34. Morgan Stanley “Does Long Distance Make Cents for the Bells”– November 2, 2001.
35. Morgan Stanley “VZ Reports 3Q01 With Few Surprises”–October 31, 2001.
36. Jefferies “Resuming Coverage of Major Wireline Carriers”–October 2001.
37. Ibid.
38. Ibid.
39. “Is Voice Going Silent? Residential Long-Distance Market Outlook,” Yankee Group, March 14, 2002.
40. SRI International, Inc. 2002.
41. Basic Telepresence, Inc. http://www.basic.com/index/html.
42. “Group predicts wireline will lose 15B consumer LD minutes," TRInsight, March 12, 2002.
43. “AT&T Loss Widened in 1st Quarter on Charge, 11% Decline in Revenue,” Wall Street Journal, April 26, 2002.
Glossary of Abbreviations
ADSL: Asymmetrical Digital Subscriber Line
AMPS: Advanced Mobile Phone Service
AOL: America Online
CDMA: Code-Division Multiple Access
CLEC: Competitive Local Exchange Carrier
CTIA: Cellular Telecommunications and Internet Association
DSL: Digital Subscriber Line
FCC: Federal Communications Commission
IBM: International Business Machines
ICQ: An internet provider company
IDG.net Infocenter: An information center on broadband technology issues
ILEC: Incumbent Local Exchange Carrier
IM: Instant Messaging
IPI: Institute for Policy Innovation
IP: Internet Protocol
IP LAN: Internet Provider Local Area Network
ISDN: Integrated Services Digital Network
ISP: Internet Service Provider
ITXC: A voice over internet protocol wholesaler
MB: megabits
Mbps: Mega Bytes Per Second
MTL: Main Telephone Line
MIS: Minimally Invasive surgery
MSN: Microsoft Network
PBX System: A central telephone system within one large business office
PC: Personal Computer
PCS: Personal Communication Systems
POTS: Plain Old Telephone Service
RBOC: Regional Bell Operating Company
SMS: Short Message Service
T1: Standard digital transmission phone line
T3: A transmission over phone lines that supports data rates of 43 Mbps
VoIP: Voice over Internet Protocol