The most remarkable aspect of the debate over the effectiveness of public school spending is why there is a debate at all. A book examining the link between spending and quality for housing, restaurant meals, automobiles, clothing, hotel rooms, wine and spirits, legal representation — indeed, most goods and services, including higher education — would not reach 50 pages before concluding that more money does produce or procure higher-quality items. Why is public education different?
The efficiency of America’s public schools is more than an academic question. The demand for increasing accountability of public schools is growing. State and local officials want to demonstrate the effectiveness of their schools to taxpayers and businesses. Several firms, including Standard & Poor’s, have begun to evaluate the efficiency of local schools, despite hostility from some administrators and the teachers’ unions (Biddle 2000; Kronholz 2001).
This report examines what America has spent on public education over the past 30 years and what the money has bought us in terms of student achievement, parental satisfaction and public confidence. It compares U.S. spending and results with those of other advanced nations. It finds that while we lead the world in spending, U.S. educational outcomes fall short. The report explores some of the reasons why the link between inputs and outputs in K-12 education is so tenuous: a system of public school monopolies defined by geography is not conducive to efficiency and accountability, and developments over the past 30 years have made matters worse.
Inputs
In 1996, state and local governments in the United States spent $279 billion on K-12 education, by far the largest item in their collective budgets. The second largest expenditure, public welfare, accounted for $193 billion; police protection $45 billion; fire protection $18 billion; and parks and recreation $19 billion. As a whole, our nation spends more on education than it spends on national defense. Social Security is the only program — federal, state or local — that consumes more money than all levels of government spend on education in the aggregate (U.S. Census Bureau 1999).
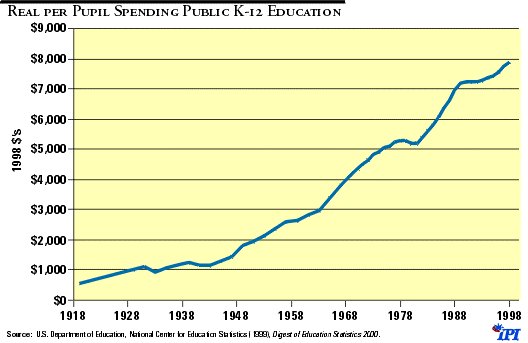
Figures 1 and 2 show the steady flow of resources into public education over the past 80 years. Figure 1 shows the ratio of K-12 spending to Gross Domestic Product (GDP: the value of all goods and services produced in the United States). Since the late 1960s, education’s share of the total economic pie has hovered around 4 percent. Figure 2 shows per pupil spending adjusted for inflation. Since 1919, real spending per student has increased from $552 (in 1998 dollars) to nearly $8,000 in 1998 — a 1300 percent increase. This is equivalent to an annual growth rate of over 3 percent per year; the economy overall has not enjoyed such consistently healthy growth.
Figure 1
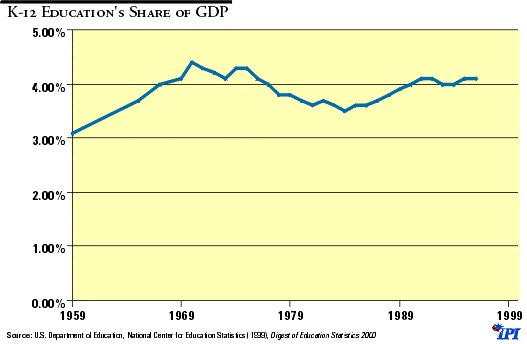
Figure 2
Where the Money Goes
The increasing flow of resources into public schools has allowed a steady improvement in other dimensions popularly associated with quality education. As Table 1 shows, over the past 40 years the number of pupils per teacher has fallen by 32 percent, the number of teachers with master’s degrees has more than doubled and teachers on average are more experienced.
Table 1
The past 40 years has seen a steady decrease in the fraction of resources being spent on salaries for instructional staff: from 61 percent in 1960 to 46 percent in 1990. However, the data available make it difficult to establish a general explanation. The fraction of resources devoted to non-school administration and maintenance has held constant. What has grown is the share devoted to fixed charges and other instructional spending (materials and school level support and clerical staff). Hanushek and Rivkin (1997) hypothesize that the growth in fixed charges is due to retirement benefits and health insurance for staff. Apparently, teachers are taking a greater share of their compensation as benefits rather than cash. They also speculate that the increase in other instructional expenditures is due to social programs that have affected the schools, in particular Title I, special education and desegregation.
Special education, which includes the federally mandated programs and procedures for educating the physically and mentally disabled, is used as a reason why per pupil spending has both steadily increased and been pronounced inadequate (Berliner and Biddle 1995). From 1978 to 1990, while overall enrollment declined, the number of students classified as disabled increased 24 percent. The number of teachers, aides and staff to deal with special education students increased nearly 60 percent (Hanushek and Rivkin 1997). During the 1990s, when enrollment increased 14 percent, the population of special education students increased 27 percent; 11 percent of students are classified as special education.
Table 2, from a detailed study of nine school districts, shows the growth in special education’s share of the budget: from an average of 3.7 percent in 1967 to 17 percent 24 years later. The shares of other programs — bilingual education, dropout prevention, counseling, vocational education and athletics — also grew but remain very small fractions of the average budget.
Table 2
Nevertheless, the evidence does not show that special education has deprived regular education of resources. Of the nine districts in the above table, per pupil spending for regular education, adjusted for inflation, grew, on average, 28.2 percent from 1967 to 1991 (Rothstein and Miles 1995). In their separate study of the growth in education spending, Hanushek and Rivkin attribute less than 20 percent of the spending growth during the 1980s to special education.
Public and Private Schools
Tables 3 and 4 compare tuition for private schools to per pupil spending in public elementary and secondary schools. Table 3 uses nationwide data collected by the U.S. Department of Education, while Table 4 uses the results of a four-city survey conducted by the Cato Institute. Both tables show that, on average, the parents of private school students pay substantially less in tuition than they pay in taxes per public school student.
Table 3
Table 4
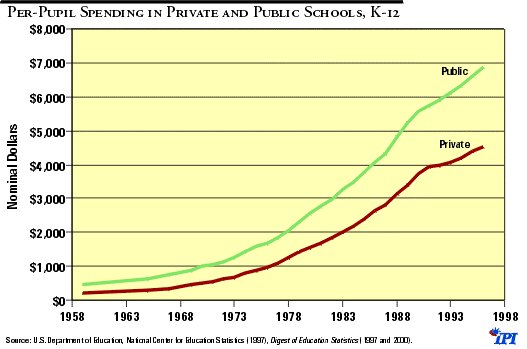
Of course private schools also benefit from philanthropic donations, fundraising drives and, like public schools, tax subsidies; tuition is not the true cost of educating students. For a better comparison, we turn to U.S. Department of Education data for total expenditures by the two types of schools. Total expenditure, the outflow of dollars for teachers, materials etc., captures not only how much parents pay into private schools, but presumably money from other sources as well. Figure 3 shows per pupil spending, for public and private K-12 schools over the past 40 years. Although private school spending has approached public school spending in percentage terms, private schools still spend only two-thirds per student, on average, of what public schools spend.
Figure 3
U.S. and the World
Compared to other advanced nations, the United States held its own in resources devoted to education in 1997. Table 5 provides an international comparison of the size of the economic pie devoted to primary and secondary education. The average shown is for all 29 OECD countries. The countries given for comparison in the table include the English speaking and Asian nations; countries with federal systems of government (Switzerland and Germany); and a country with a centralized government (France). The U.S. is about average for developed countries in the share of GDP devoted to public education.
Table 5
Some countries, however, have bigger pies than others, so the share of GDP taken by education serves only as a rough comparison among nations. In terms of money spent per pupil, the United States is substantially above the average. Indeed, among the developed countries we rank behind only Denmark, Austria, Norway and Switzerland. [See Table 6]
Table 6
American schools, public and private, devote a smaller share of the funding pie to compensation for teachers than the average advanced country (57 percent versus 64 percent) and more to the compensation of other staff (22 percent versus 14 percent). Capital expenditures in the U.S. are near average (OECD Table B5.1). The pupil-teacher ratio is also close to the 29-country average — a little below average for primary schools, above average for secondary (OECD Table B7.1). Although the overwhelming amount of support for primary and secondary education in the advanced countries comes from the government, there are interesting variations. In Germany, 24 percent of funding for primary and secondary education comes from private sources, compared to 14 percent in Australia, 0 percent in Sweden and Italy, and 9 percent in the United States (OECD Table B2.1).
Outputs
In the previous section we saw that over the past century, certainly over the past 40 years, public schools in the United States have not been starved of resources. The inflation-adjusted amount of money spent per pupil has steadily increased, and the money has been spent in ways we are commonly exhorted to spend it: lowering the ratio of teachers per pupil and hiring more experienced and more educated teachers. We now turn to the question of what the public has received for its money.
Although the data is too scarce to tell for sure, cognitive achievement during the first half of the 20th century appears to have been steady (Stedman 1996) if not increasing (Bishop 1989). Certainly the environment for learning was improving during this time: families became smaller and parents more educated. The proportion of children living in one-parent families fell from 17 percent to 13 percent (Bishop 1989). The number of days in the school year grew; more children attended school and completed more years.
Knowing what happened to educational achievement after World War II is easier due to an abundance of measures. After the war through the mid-1960s, achievement trended upward. In the mid-1960s, the various measures started showing an unmistakable decline. The fall in SAT scores was dramatic and is well-known (Figure 4), but other scores — on the Iowa Test of Basic Skills, the Stanford Achievement Test, the California Achievement Test and the ACT — fell as well (Bishop 1989).
Figure 4
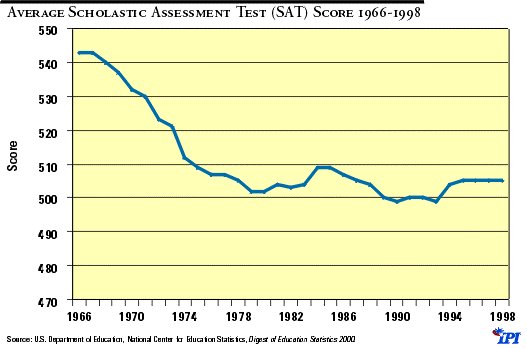
The SAT is taken by students planning to attend college, and the broadening of the college-bound population during this time is sometimes blamed for the fall in test scores. This cannot explain the decrease in the scores of other standardized tests, nor can it entirely explain what happened to SAT scores. Even adjusting for an increasing number of test takers, the average score fell (Dynarski 1987). The best estimates are that up to 75 percent of the decline in the 1960s and 30 percent in the 1970s was due to the changing demographics of test takers (Stedman 1996, p. 290).
Test scores are not the only things that fell during this time. The graduation rate, which hit a high of 77 percent in 1969, has fallen steadily and now is 71 percent (U.S. Department of Education1999). Confidence in public schools also has declined. In 1973, 58 percent of those polled by Gallup had a “ great deal” or “quite a lot” of confidence in public schools. By 2000 this had fallen to 37 percent. Public schools ranked behind the military, the police, churches, the Supreme Court, the medical system and the presidency in public confidence; they beat the media, Congress, organized labor and big business, the criminal justice system and HMOs (Chambers 2000).
The quality of textbooks has also declined, although some put the beginning of this trend even earlier (Coulson 1996). Cornell professor Donald Hayes sampled 788 textbooks between 1860 and 1992 and estimated that the language difficulty of textbooks had fallen by 20 percent during the past few generations. He commented that today’s honors textbooks are about as difficult as an eighth-grade reader before World War II (quoted in Hubisz 2000).
One aspect, besides spending, of public education that has increased over the past 30 years is the grades received by students. In 1969 only 12.5 percent of college freshmen reported earning an “A” average in high school — ; by 1999, 34 percent did. The number earning a “C” or lower average fell from 32.5 percent in 1969 to 12 percent 30 years later (Sax et al 1999).
This apparently spectacular increase in achievement is not mirrored in the National Assessment of Educational Progress (NAEP). The NAEP provides an indicator of what is happening to all students — not just those headed for college. The NAEP, “the Nation’s Report Card,” has measured student achievement nationwide for 30 years by testing representative samples of America’s students. It has tracked performance in reading, science and math during this time, and has recently branched out into history, geography, civics, writing and art. Figure 5 shows the trends (or lack thereof) in achievement for 17-year-olds in reading, math and science. (The NAEP also tests nine- and 13-year-olds, but this report will focus on the oldest group as they represent the final product of the system.)
Figure 5
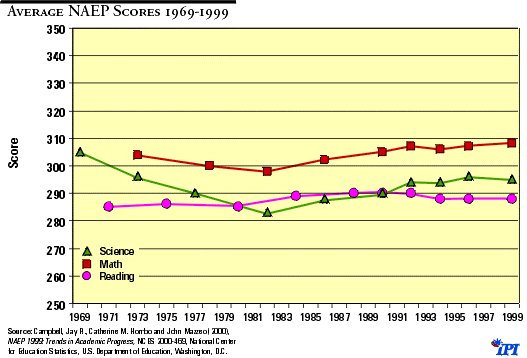
The NAEP catches the end of the test score decline of the 1960s and 1970s: there is a distinctive early downward trend in science, and a slighter one in math. Math scores, however, improve until performance in 1999 is significantly higher than in 1973; science scores have not regained the ground lost since 1969. Reading achievement has been flat for the entire 30 years.
Figure 6
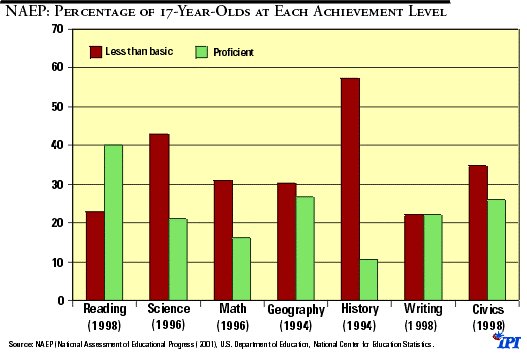
The trends in the NAEP are not particularly dramatic, and perhaps they are even hopeful. The achievement levels reached by America’s students, however, provide less reason to be sanguine (figure 6). In all seven subjects examined by the NAEP at least 20 percent, or one student in five, fails to attain basic proficiency. Performance in history and science are particularly abysmal. Only in reading are more than 30 percent proficient or better, but even here the news is not all happy. Over the past decade, the percentage of students unable to perform at the basic level has risen. On the other hand, there is good news in math achievement; over the same period a greater fraction of students have reached the basic and proficient levels of achievement.
Public and Private Schools
In the 1999 round of the NAEP, 17-year-olds in private schools outscored their peers in public schools on average by 7 percent in reading, 5 percent in math and 6 percent in science. This difference is commonly dismissed with the observation that private schools select and are selected by wealthier, more motivated parents and brighter students. A small cottage industry of social scientists has labored on determining if private schools are indeed better than public ones after controlling for student and parent characteristics. These studies primarily focus on Catholic schools, which account for a majority of private school students and thus provide data ample enough for rigorous statistical tests. Studies have found, even after controlling for other factors, that students in Catholic schools outperform similar students in vocabulary, math and reading; and that Catholic school students have a higher probability of finishing high school, attending college and receiving a degree.
However, other studies have found no significant difference between the two types of schools. The various experiments in school choice have also found mixed effects. Partisans on both sides of the debate have a ready arsenal of academic studies to launch at their opponents1 Still, no large body of work has found that private schools are worse than public schools; and considering that the average per pupil cost for private schools is two-thirds that of the average public school, they can be considered a bargain. Public schools are less efficient than their private counterparts in turning dollars into results.
Private schools do outperform their public counterparts in parental satisfaction. Some 81 percent of parents with children in private schools rate their children’s education as excellent, compared to only 25 percent of public school parents (Portrait of America 2000). The same is true for parents participating in the various school choice programs. In Cleveland, for example, 50 percent of participating parents said they were very satisfied with the academic program, safety, discipline and teaching of moral values in their private school. Only 30 percent of the city’s public school parents said they were very satisfied (Greene 2000a).
U.S. and the World
Since the United States is a global leader in spending per pupil (number five in 1997), it is disappointing to find that we do not reach a similarly lofty status in school achievement. Table 7 shows the performance of American students in international tests of math and science over the past 40 years. Two patterns are evident. First, U.S. students tend to perform comparatively better in science than in math. Second, although U.S. students hold their own at young ages, they tend to fall behind as they move up in grade level. And in reading, although U.S. 9-year-olds scored behind only Finland in the latest evaluation, our 14-year-olds ranked seventh. In terms of value added per dollar, we ranked last (Walberg 1996).
Table 7
There are other indications that the use of the last four years of education in America’s public schools is suboptimal: most 17-year-olds in other countries are studying math, one-third of U.S. students are not. Nearly two-thirds of final-year students in other countries are studying science, two-thirds of American students are not (National Commission on the High School Senior Year 2001). A recent survey of college freshmen found that only 31.5 percent report studying or doing homework more than six hours per week during their senior year; 40.2 percent studied less than three hours per week and 17.1 percent studied less than one hour per week (Sax et al. 1999).
Berliner and Biddle, among others, assert that the most advanced American students compare well with their peers in any other country and that a relatively large population of disadvantaged students depresses the U.S. average. However, that cadre of elite students is small. Among 13-year-olds who took the TIMSS (Third International Math and Science Study), only 5 percent of U.S. students were in the top 10 percent internationally in math — compared to 7 percent in Germany and France, 18 percent in the Czech Republic and 32 percent in Japan. In science, 13 percent of American students were in the top 10 percent internationally — compared to 18 percent in Korea and Japan, 19 percent in the Czech Republic, 11 percent in Russia and Germany and 1 percent in France (U.S. Department of Education 1996).
Among high school seniors, advanced math students in 11 of 16 countries significantly outscored their American peers. Considering only those U.S. students who had taken calculus, advanced students in six countries still performed better, although our advanced placement calculus students were beaten only by the French. Among advanced science students, 14 out of 16 countries did significantly better on the physics portion of the test than the United States (U.S. Department of Education 1998).
The Cost of Poor Performance
Berliner and Biddle discount the international comparisons, asserting that the tests are biased and inconsistent and do not capture the breadth and alternate emphases of American education. Nevertheless, Hanushek and Kimko (2001) find that scores on these international tests are strongly related to economic growth. Countries with high scores have skilled labor forces and thus grow faster. Indeed, these test scores serve as a better indicator of the human capital embodied in a nation’s labor force than spending on education, student-teacher ratios and enrollment rates2 Berliner and Biddle dismiss “human capital ideology” as a dangerously narrow view of the purpose of education. Be that as it may, publicly funded education is an important weapon in the war on poverty, and it should operate at full efficiency.
Poorly prepared students impose costs on colleges, employers and themselves most of all. Unfortunately, evidence regarding the overall magnitude of these costs is spotty and anecdotal. The latest survey of college freshmen found all-time highs in the number of students taking remedial courses in high school: 12.7 percent in mathematics, for example, and 5.1 percent in foreign languages. The fraction taking remedial coursework in science (5.1 percent) is at a 20-year high, with nine-year highs in English (6.3 percent), reading (5.6 percent), and social studies (4.0 percent). Since 1982 the percentage of college freshmen that have taken at least one remedial course has increased from 12 percent to 18 percent (Sax et al. 1999).
The same study found that college freshmen are increasingly less engaged. A record 39.9 percent say they are frequently bored in class. The fraction that arrived late to class occasionally or frequently also is at an all-time high (60.3 percent, compared to 49.2 percent in the 1960s). The number who have overslept and missed a class or appointment was 36.2 percent, compared to 18.8 percent in 1968. At the same time, more freshmen report feeling overwhelmed.
Seventy-five percent of U.S. colleges offer remedial courses in reading, writing and math. In 1993, nearly 50 percent of the freshman class of the California State universities needed remedial assistance. The California State universities estimated that the cost of remedial help was $10 million per year; the University of California estimates the annual cost of their remedial programs at $1.6 million (Manno 1995). In the fall of 1995, 13 percent of freshmen at the Amherst and Boston campuses of the University of Massachusetts were taking at least one remedial course. Also in Massachusetts, the figure at Fitchburg State was 44 percent and at Worcester State, 20 percent (Dembner 1996).
The most recent survey of Training magazine found that 30 percent of businesses and other organizations offer remedial training: 35 percent had a training program for remedial math, 28 percent for remedial writing and 28 percent for remedial reading (Business Wire 2000). AT&T has reported that, on average, 115 out of 117 applicants fail its employment exam. Motorola found that 80 percent of its applicants fail an exam that evaluates English skills at the seventh-grade level and math skills at the fifth-grade level (Klick 2000).
Systematic studies find that the cost of poorly prepared students is significant. Bishop estimated that the decline in test scores from 1967 to 1980 cut labor quality 2.9 percent, and in 1987, the year the study was done, cost the U.S. economy $86 billion in foregone output. Bishop calculated that the cumulative cost of the decline between 1987 and 2010 is $3.2 trillion in 1987 dollars ($4.9 trillion in 2000 dollars). A study of Michigan found that the cost to businesses and schools in that state of unprepared high school graduates was $601 million per year. The author’s extrapolation of this figure to the entire United States yields an annual cost of the lack of basic skills in American workers of $16.6 billion (Greene 2000b).
Does Money Matter?
The data presented so far have been suggestive but not definitive. Simple graphs and tables do not control for other factors that could hide any link between spending and achievement. Parents have become more educated, but the number of single-parent families has grown; English is not the first language of an increasing proportion of students.
Armies of scholars have tried to cut through the thicket of influencing factors to find the link between spending (and other education inputs) and student achievement. The past three decades have seen nearly 400 studies trying to pinpoint the effects of, for example, spending, class size and teachers’ salaries. Hanushek (1997) tabulated the results, which appear in Table 8 and are read in the following manner: of 377 studies tabulated, 277 have attempted to estimate the effect of teacher-pupil ratios on student performance. Of these, 15 percent found that fewer pupils per teacher have a statistically positive effect on student achievement, 13 percent found a negative effect and 72 percent found no statistically significant effect.
Table 8
Many people will find the information in Table 8 startling. The standard prescriptions for fixing what is wrong with America’s schools — spending more, lowering class sizes, raising teachers’ salaries, building nicer schools — have very mixed evidence to support their effectiveness. Some studies do find these measures improve student achievement, others find an adverse effect and the majority find no impact whatsoever.
However, the effectiveness of the education inputs listed in Table 8 does have the support of common sense. What industry would not benefit from more qualified, highly paid workers and more money spent on resources and facilities? The lesson from Table 8 is not that these inputs never matter; it is that the public education system in the United States cannot use them to consistently deliver results. The next section will explore some reasons why.
Reasons for Public School Inefficiency
A comprehensive discussion of why America’s public schools are inefficient would require a long paper if not a large book. A common explanation is the inefficiency associated with a monopoly — what economists give the ominous name “x-inefficiency.” For public agencies, a closely analogous term is “rent seeking.” Rent seeking by public agencies results in the growth of a sclerotic bureaucracy, and studies have found that a large educational bureaucracy reduces achievement and induces parents to choose private schools (West and Palsson 1988; Anderson et al. 1991).
Below, I explore two particular reasons for the decline in test scores of the 1960s and 1970s (Peltzman 1993 and 1996). They might also explain why the link between school inputs and outputs earlier in this century appears to have weakened over the past 40 years (Betts 1995; Hoxby 1996). The two reasons are the increasing centralization of school funding and the rise of teachers’ unions.
No Voice, No Exit: the Centralization of School Spending
Underlying the debate over school reform in the United States is Albert Hirschman’s dichotomy of how organizations are influenced: voice and exit (Hirschman 1970). Voice, associated with politics, is affecting an organization through political action: meeting, debating, petitioning and voting. Exit, associated with markets, is leaving an organization that fails to adequately fulfill its purpose. Exit is a factor in any area where individuals have choice. Museums or restaurants, movie theaters or schools, organizations that cannot attract and keep patrons, members or customers ultimately shut their doors.
Across the world, markets have proven superior to politics in providing goods and services. Thus, it is logical to suggest America’s public school children would benefit from a choice of educational alternatives. This view is somewhat simplistic. It overlooks the fact that in one sense parents and children in the United States have been able to choose their school, even if we do not take into account private schools. Every realtor in the country knows that parents can and do choose schools by deciding where to live.
Choosing by moving — or to meld Hirschman’s dyad, voting with one’s feet — was advanced by economist Charles Tiebout in a seminal paper as an efficient way to provide public goods (Tiebout 1956). In what is called “Tiebout competition,” people migrate from badly governed cities, states or school districts to those that are well governed. Ultimately, people may choose the community with the level of public services closest to their “most preferred.” Some live where the buses run 24 hours and the school has a domed stadium; others where there are no buses and the football team has to play in a nearby park.
Theoretically, Tiebout competition, combined with local property taxes, is an efficient mechanism for regulating public schools. As realtors know and researchers agree (see Oates 1969 and Bogart and Comwell 1997, for example), location in a district with good schools raises the price of a house. This provides a positive feedback mechanism for school administrators. If a district operates good schools, families want to move into it. If families want to move in, housing prices go up. If housing prices go up, schools receive more property tax revenue. Of course, the opposite happens if the schools are poorly run.
This mechanism has two interesting implications. First, even households with no children care about the quality of the local schools since it affects their property values. Second, housing prices can be a barrier to good schools for low-income families, just as if the schools charged tuition.
The necessary ingredients for Tiebout competition are many local political jurisdictions, each with significant taxing and spending power, and the freedom of citizens to move. While the last condition has almost never been a problem in the United States, the first two are constantly under siege, and not just in education. Revenue sharing, regional governments, school district consolidation and the flow of power upward to state and federal governments make physical moves less meaningful..
Tiebout competition does work for education (Borland and Howsen 1992; Blair and Staley 1995; Hoxby 2001). In areas with multiple school districts, children perform better and schools spend less. Unfortunately, local control and Tiebout competition have steadily eroded over the past 30 years.
In the 1960s squadrons of lawyers supported by grants from foundations and the federal government began lawsuits in various states petitioning that local school funding mechanisms be declared unconstitutional on equal protection grounds. The equal protection arguments found little sympathy in federal courts, but succeeded in state supreme courts where judges could often point to specific clauses in their state’s constitution requiring equity in education. In the landmark Serrano decisions of the 1970s, the California Supreme Court not only declared that the state’s system of supporting schools through local property taxes was unconstitutional but that differences in per pupil spending statewide could be no more than $100 (Fischel 1989, 1998).
State legislatures took on an increasing role as they sought to meet the courts’ mandates, and children nationwide had the dubious opportunity to participate in judicial experiments on the link between school spending and achievement. The results of this experiment are, as can be expected from the above discussion on spending and achievement, unclear. Perhaps the most egregious failure was in Kansas City, Missouri. There a federal judge took partial control of the school district and essentially handed its administrators a blank check. Per pupil spending was hiked to $11,700, and the extra money used to pay for higher teacher salaries, new schools, an Olympic-sized swimming pool with an underwater viewing room, television and animation studios, a robotics lab, a wildlife sanctuary and field trips to Mexico and Africa. In the end, test scores remained low, the achievement gap between white and black students did not narrow, and the schools were less integrated (Ciotti 1998).
Robbed of their voice by state legislatures and judges, parents headed for the exits — taking their money with them. Serrano has been linked to the passage of Proposition 13, the California initiative that dramatically rolled back property taxes in the state. Since their taxes went to the state capital in Sacramento to be doled out by the legislature instead of staying under local control, Californians voted to slash funding for the system (Fischel 1989). School funding reform in California has also been associated with an increase in private school attendance in the state (Downes and Schoeman 1998). Finally, the increase in state government, as opposed to district, shares in funding caused by attempts at equalization has decreased school efficiency (Husted and Kinney 1997).
Centralization of funding diminishes the effect of Tiebout competition. Since funding is determined by state formula, the property tax feedback mechanism is muted. State and federal legislators usually send money to districts with regulations attached. The erosion of local control in education and the associated decline of public school efficiency and achievement have not made their way into popular consciousness as have other stories about the decline of public education. They should, since many look in vain to higher levels of government to improve education in America.
Alternate Voices: The Rise of Teachers’ Unions
Simultaneous with the decline of test scores in the 1960s was the rise of teachers’ unions. Before that decade, few teachers belonged to a union. By 1990, three of every four were members (Peltzman 1993). This has been alternately characterized as professional empowerment and simple self-interest.
Union contracts and the rules they impose on administrators have been named as sources of public school inefficiency (Ballou 1999). The salary schedules, grievance procedures and seniority-based assignments tie administrators’ hands — preventing them from culling the incompetent and rewarding the able. Salary schedules that reward teachers solely for years of experience and years of schooling prevent administrators from paying more for those qualified to teach in areas where teachers are sorely needed. This results in the most able math and science teachers seeking jobs elsewhere, adversely affecting student achievement (Southwick and Gill 1997).
Unions also are the reason increasing teacher pay is an ineffective way to improve student performance. Unions demand that pay raises be given across-the-board, rewarding both good teachers and bad. These higher salaries induce senior teachers to stay longer, creating fewer openings for new hires. Thus, no spaces are open for the younger, more-qualified applicants whom policy makers hope to attract (Ballou and Podgursky 1995).
As outlined above, union-imposed salary schedules and burdensome certification requirements put in place at the behest of teachers’ unions and schools of education have been blamed for the fact that those choosing to teach are those with the weakest academic records. However, an intriguing study by Ballou (1996) suggests that the teaching guild is not solely to blame. Ballou finds that the quality of the applicant’s college has no effect on whether she will receive an offer of employment from a public school. He also finds that those hiring weigh an education degree more than a major in a subject area like math, English or science. In other words, school administrators do not necessarily hire the best, even when the best apply. Ballou attributes this to a lack of accountability and incentives to hire the best-qualified applicants.
Private schools pay substantially less than public ones, but Ballou and Podgursky (1998) find private school principals at least as satisfied as their public counterparts with the quality of their teachers. Private schools are also more successful in retaining and developing the skills of their teaching staff. The study’s authors attribute this to private schools’ greater flexibility in mentoring and rewarding the good teachers and dismissing the bad ones.
Finally, evidence suggests that the emergence of unions as a powerful interest group has driven parents to the exit. West and Palsson (1988) find that long teachers’ strikes alienate parents from the public system and cause private school enrollment to increase.
Conclusion
This report has shown that the flow of resources into America’s public schools has kept ahead of inflation and the number of students and that America leads the world in the amount of money it spends per pupil. Yet this tremendous effort has not been matched by gains in achievement. During the 1960s, student achievement fell as spending rose, and nothing we have done over the past 30 years has reversed that pattern. Private schools produce equal or better results at a lower cost. Internationally, the standing of U.S. students, particularly in high school, is not matched by the effort we expend.
Many explanations have been offered for the inefficiency of public schools, the standard one being the x-inefficiency of a monopoly or the rent seeking of a public bureaucracy. This report focused on two explanations that have shown how the balance of political power has shifted in schools over the past four decades: the centralization of funding and the rise of teachers’ unions.
Turning the clock back 40 years is impossible. The voices of state and federal politicians and administrators, judges, lawyers, teachers’ unions and other “stakeholders” have drowned out those of parents and local school officials. The groups that have benefitted from recent past developments will not surrender their gains easily. Any solution to the inefficiencies of public school is to be found not in politics but in markets. The various voucher experiments have found promising results (Greene 2000a, Howell et al 2000). In addition, competition from private schools improves the quality of public schools as measured by the educational attainment, wages and graduation rates of public school students (Hoxby 1994).
In Arizona, where 6 percent of public school children attend charter schools, the competition has made public school districts more responsive. Parents in one district wanted the schools to teach their children phonics. Since the district reading program did not offer it, the parents pressed for the opening of a charter school with a phonics-based curriculum. That school lured away nearly half of the district’s enrollment. In response, the district modified its reading program to offer a choice of phonics or whole language instruction. Another large urban district, concerned at the number of students leaving for charter schools, instituted a customer service program to win students back.
School choice, whether through vouchers or charter schools, has the potential to restore local accountability and engender the efficiency that is found in other markets.
Endnotes
1 For both sides, see Goldhaber (1996), Howell et al. (2000), Greene (2000a) and Shokraii (1997).
2 Of course, the quality of the labor force is not the only factor contributing to economic growth. Hanushek and Kimko find that the United States performs much better economically than expected given its ranking on international tests. They hypothesize that this might be due to our excellent system of higher education or our more open, competitive markets. Japan and Germany are examples of the opposite: countries whose growth has been much lower than expected given the academic achievement of their students.
References
Anderson, Gary M., William F., Shughart II and Robert D. Tollison (1991), “ ;Educational Achievement and the Cost of Bureaucracy,” Journal of Economic Behavior and Organization, 15, pp. 29-45.
Ballou, Dale (1996), “Do Public Schools Hire the Best Applicants?” Quarterly Journal of Economics, 111 (February), pp. 97-133.
Ballou, Dale (1999), The New York City Teachers’ Union Contract: Shackling Principals’ Leadership, Civic Report 6, Manhattan Institute for Policy Research, New York, N.Y.
Ballou, Dale and Michael Podgursky (1995), “Recruiting Smarter Teachers,” Journal of Human Resources, 30 (2), pp. 326-38.
Ballou, Dale and Michael Podgursky (1998), “Teacher Recruitment and Retention in Public and Private Schools,” Journal of Policy Analysis and Management, 17 (3), pp. 393-417.
Berliner, David C. and Bruce J. Biddle (1995), The Manufactured Crisis, Perseus Books, Reading, Mass.
Betts, Julian (1995), “Does School Quality Matter? Evidence from the National Longitudinal Survey of Youth,” The Review of Economics and Statistics, 77, pp. 231-50.
Biddle, Rishawn (2000), “School of Hard Knocks,” Forbes, December 11, pp. 80-82.
Bishop, John H. (1989), “Is the Test Score Decline Responsible for the Productivity Growth Decline,” American Economic Review, 79 (1), pp. 178-97.
Blair, John P. and Samuel R. Staley (1995), “Quality Competition and Public Schools: Further Evidence,” Economics of Education Review, 14 (2), pp. 193-98.
Boaz, David and R. Morris Barrett (1996), “What Would a School Voucher Buy? The Real Cost of Private Schools,” Briefing Paper 25, Cato Institute, Washington, D.C.
Bogart, William T. and Brian A. Cromwell (1997), “How Much More Is a Good School District Worth?” National Tax Journal, 50 (2), pp. 215-32.
Borland, Melvin V. and Roy M. Howsen (1992), “Student Academic Achievement and the Degree of Market Concentration in Education,” Economics of Education Review, 12 (1), pp. 31-39.
Burtless, Gary Ed. (1996), Does Money Matter? Brookings Institution, Washington, D.C.
Business Wire (2000), “Training Magazine Releases Annual Industry Report Findings,” November 17, http://www.businesswire.com.
Campbell, Jay R., Catherine M. Hombo and John Mazzeo (2000), NAEP 1999: Trends in Academic Progress, NCES 2000-469, National Center for Education Statistics, U.S. Department of Education, Washington, D.C.
Chambers, Chris (2000), “Military Number One in Public Confidence, HMOs Last,” Poll Releases, The Gallup Organization, July 10, http://www.gallup.com.
Ciotti, Paul (1998), “Money and School Performance: Lessons from the Kansas City Desegregation Experiment,” Policy Analysis 298, Cato Institute, Washington, D.C.
Coleman, Stephen (1995), “Debunking the Manufactured Crisis: Dispelling Myths about Public Education,” Goldwater Institute, Phoenix, Ariz.
Coulson, Andrew J. (1996), “Schooling and Literacy Over Time: The Rising Cost of Stagnation and Decline,” Research in the Teaching of English, 30 (3), pp. 311-327.
Dembner, Alice (1995), “Colleges consider intensive training: Boot camp eyed for remedial aid,” The Boston Globe, p. B1.
Downes, Thomas A. and David Schoeman (1998), “School Finance Reform and Private School Enrollment: Evidence from California,” Journal of Urban Economics, 43, pp. 418-43.
Dynarski, Mark (1987), “The Scholastic Aptitude Test: Participation and Performance,” Economics of Education Review, 6 (3), pp. 263-73.
Fischel, William A. (1989), “Did Serrano Cause Proposition 13?” National Tax Journal, 42 (4), pp. 465-73.
Fischel, William A. (1998), School Finance Litigation and Property Tax Revolts: How Undermining Local Control Turns Voters Away from Public Education, Lincoln Institute of Land Policy , Cambridge, Mass.
Goldhaber, Dan D. (1996), “School Choice: An Examination of the Empirical Evidence on Achievement, Parental Decision Making, and Equity,” Educational Researcher, 28 (9), pp. 16-25.
Greene, Jay P. (2000a), A Survey of Results from Voucher Experiments: Where We Are and What We Know, Civic Report 11, Manhattan Institute for Policy Research, New York, N.Y.
Greene, Jay P. (2000b), The Cost of Remedial Education, Mackinac Center for Public Policy, Midland, Mich.
Hanushek, Eric A. (1997), “Assessing the Effects of School Resources on Student Performance: An Update,” Educational Evaluation and Policy Analysis, 19 (2), pp. 141-164.
Hanushek, Eric A. (1998), “Conclusions and Controversies about the Effectiveness of School Resources,” FRBNY Economic Policy Review , March, pp. 11-27.
Hanushek, Eric A. and Dennis M. Kimko (2000), “Schooling, Labor-Force Quality, and the Growth of Nations,” American Economic Review , 90 (5), pp. 1184-1208.
Hanushek, Eric A. and Steven G. Rivkin (1997), “Understanding the Twentieth-Century Growth in U.S. School Spending,” The Journal of Human Resources, 32 1), pp. 33-68.
Hirschman, Albert O. (1970) Exit, Voice and Loyalty: Responses to Decline in Firms, Organizations and States, Harvard University Press, Cambridge, Mass.
Howell, William G. et al. (2000), “Test-Score Effects of School Vouchers in Dayton, Ohio, New York City, and Washington, D.C.: Evidence from Randomized Field Trials,” prepared for the annual meeting of the American Political Science Association, http://data.fas.harvard.edu/pepg.
Hoxby, Caroline Minter (1994), “Do Private Schools Provide Competition for Public Schools?” Working Paper 4978, National Bureau of Economic Research, Cambridge, Mass.
Hoxby, Caroline Minter (1996), “How Teachers’ Unions Affect Education Production,” Quarterly Journal of Economics, 111 August), pp. 671-718.
Hoxby, Caroline Minter (2001), “Does Competition Among Public Schools Benefit Students and Taxpayers?” American Economic Review, 90 (5), pp. 1209-38.
Hubisz, John L. (2000), Review of Middle School Physical Science Texts, Final Report, David and Lucile Packard Foundation, Grant 1998-4248.
Husted, Thomas A. and Lawrence W. Kinney (1997), “Efficiency in Education: Evidence from the States,” 1996 Proceedings from the Eighty-ninth Annual Conference on Taxation , National Tax Association.
Klick, Jonathan (2000), “Do Dollars Make a Difference? The Relationship Between Expenditures and Test Scores in Pennsylvania’s Public Schools,” American Economist, 1, Spring.
Kronholz, June (2001), “Bringing ‘Accountability’ to Schools May Be Hard,” Wall Street Journal, January 23, p. A24.
Manno, Bruno (1995), “Remedial Ed: Far too many students begin college unprepared, San Diego Union-Tribune, July 16, p. G1.
Medrich, Elliot A. and Jeanne E. Griffith (1992), International Mathematics and Science Assessment: What Have We Learned? NCES 92-011, U.S. Department of Education, Office of Educational Research and Improvement, Washington, D.C.
NAEP (National Assessment of Educational Progress (2001), U.S. Department of Education, National Center for Education Statistics, http://www.nces.ed.gov/nationsreportcard.
National Commission on the High School Senior Year (2001), The Lost Opportunity of Senior Year: Finding a Better Way.
Oates, Wallace E. (1969), “The Effects of Property Taxes and Local Public Spending on Property Values: An Empirical Study of Tax Capitalization and the Tiebout Hypothesis,” Journal of Political Economy, 77 (November), pp. 957-71.
OECD, (Organization for Economic Cooperation and Development) (2000), Education at a Glance, Paris, France.
Peltzman, Sam (1993), “The Political Economy of the Decline of American Public Education,” Journal of Law and Economics , 36 (April), pp. 331-83.
Peltzman, Sam (1996), “Political Economy Public Education: Non-College-Bound Students,” Journal of Law and Economics , 39 (April), pp. 73-120.
Portrait of America (2000), “Private Schools Get Top Ratings,” January 30, http://www.portraitofamerica.com.
Rothstein, Richard and Karen Hawley Miles (1995), Where’s the Money Gone? Economic Policy Institute, Washington, D.C.
Sax, L.J. et al. (1999), The American Freshman: National Norms for Fall 1999, Higher Education Research Institute, University of California, Los Angeles.
Shokraii, Nina H. (1997) “Why Catholic Schools Spell Success for America’s Inner-City Children,” Backgrounder 1128, the Heritage Foundation, Washington, D.C.
Southwick, Lawrence Jr. and Indermit S. Gill (1997), “Unified Salary Schedule and Student SAT Scores: Adverse Effects of Adverse Selection in the Market for Secondary School Teachers,” Economics of Education Review, 16 (2), pp. 143-53.
Stedman, Lawrence C. (1996), “An Assessment of Literacy Trends, Past and Present,” Research in the Teaching of English, 30 (3), pp. 283-302.
Tiebout, Charles M. (1956), “A Pure Theory of Local Expenditures,” Journal of Political Economy, 64 (October), pp. 416-24.
TIMSS (Third International Mathematics and Science Study) (2000a), TIMSS 1999 International Mathematics Report.
TIMSS (Third International Mathematics and Science Study) (2000b), TIMSS 1999 International Science Report.
U.S. Census Bureau, Statistical Abstract of the United States: 1999, Washington, D.C.
U.S. Department of Education, National Center for Education Statistics (1996), Pursuing Excellence: A Study of U.S. Eighth-Grade Mathematics and Science Teaching, Learning, Curriculum, and Achievement in International Context, NCES 97-198, Washington, D.C.
U.S. Department of Education, National Center for Education Statistics (1997), Digest of Education Statistics 1997, http://www.nces.ed.gov.
U.S. Department of Education, National Center for Education Statistics (1998), Pursuing Excellence: A Study of U.S. Twelfth-Grade Mathematics and Science Achievement in International Context, NCES 98-049, Washington, D.C.
U.S. Department of Education, National Center for Education Statistics (1999), Digest of Education Statistics 2000, http://www.nces.ed.gov.
Walberg, Herbert J. (1996), “U.S. Schools Teach Reading Least Productively,” Research in the Teaching of English, 30 (3), pp. 328-43.
West, Edwin G. and Halldor Palsson (1988), “Parental Choice of School Characteristics: Estimation Using State-Wide Data,” Economic Inquiry, 26 (October), pp. 725-40.